
Figure 1.
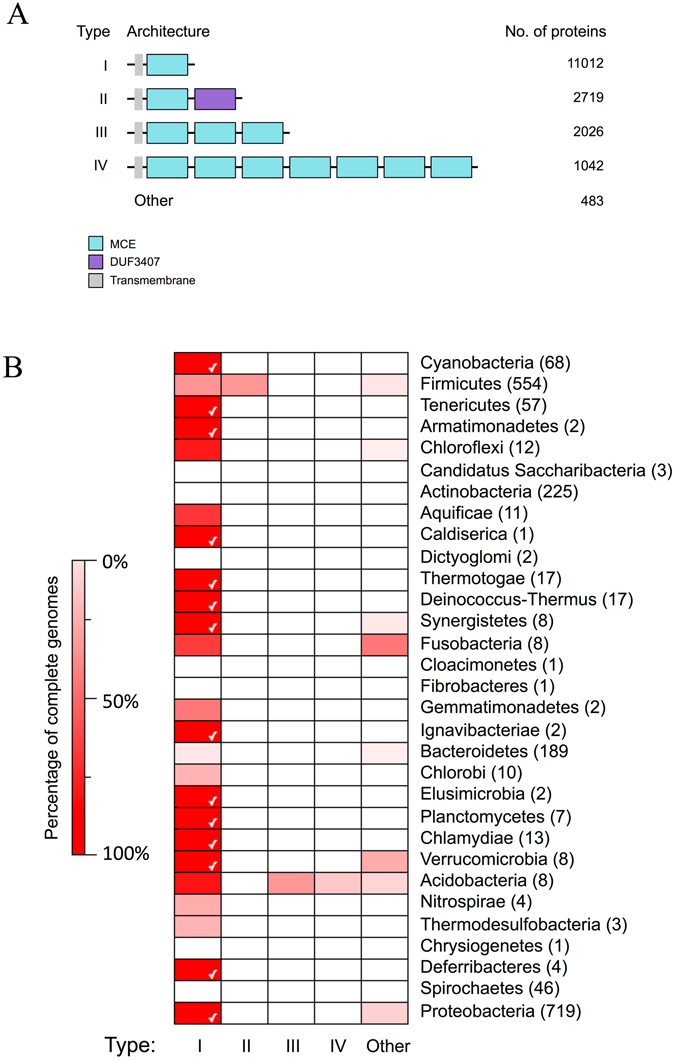
The distribution of the top MCE protein architecture across bacteria. (A) The top four MCE protein architectures by number of proteins. These were identified by scanning the UniprotKB protein database with the MCE hidden Markov model and other models from PFAM. (B) A heat map showing the distribution of the architectures across bacterial phyla, to include all species with a full genome sequence. The colours are based on percentages ranging from 0% (white) to 100% (bright red). The phyla are displayed on the right of the heat map and the number of species is in brackets. The phyla are ordered based on the tree of life32, ranging from early (top) to late (bottom) branching bacteria. A white tick is displayed when an architecture is found in 100% of the analysed species within a phylum.