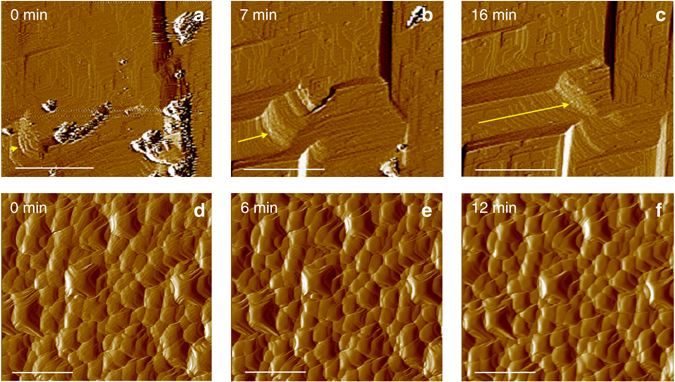
Fig. 7.

Time-resolved in situ AFM images of the dissolution of calcite. a–c control (untreated) and d–f bacterially treated (104) calcite surface exposed to flowing 1 M MgSO4 solution. Time = 0 min represent the moment when the saline solution was injected into the AFM fluid cell. The yellow arrows in a–c show the retreat of the macrostep over time (due to fast calcite dissolution). Note that no dissolution features are observed in d–f over the time course of the dissolution experiment. Scale bar: 1 µm
