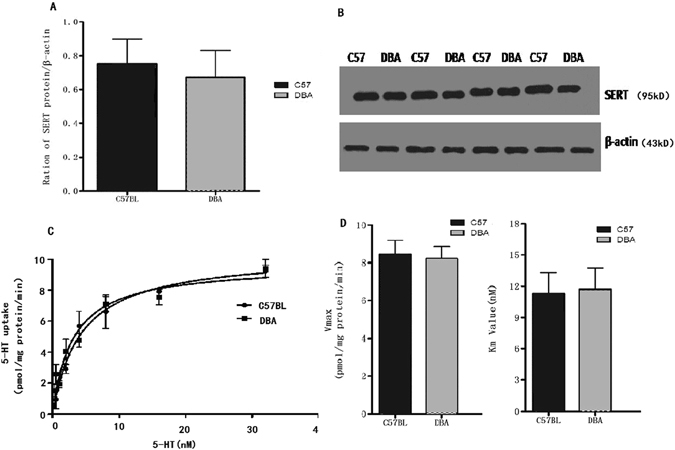
Figure 4.

SERT protein expression (A) was measured by Western blotting (right) and normalized to β-actin levels (B); the samples were derived from the same experiment, and the gels were processed in parallel. SERT expression did not differ between C57BL/6J and DBA/2J mice (Student’s t-test, p > 0.05; n = 4 per strain). Saturation uptake kinetics in C57BL/6J and DBA/2J mice whole-brain synaptosomes (C,D). C57BL/6J and DBA/2J mice do not differ in 5-HT transport activity (C57BL/6J:Vm 8.23 ± 2.28 nM; Kmax 6.54 ± 1.27 pmol/min-mg protein; DBA/2J: Km7.51 ± 2.67 nM; Vmax12.22 ± 3.09 pmol/min-mg protein: Student’s t-test, p > 0.05, n = 6 per strain).
