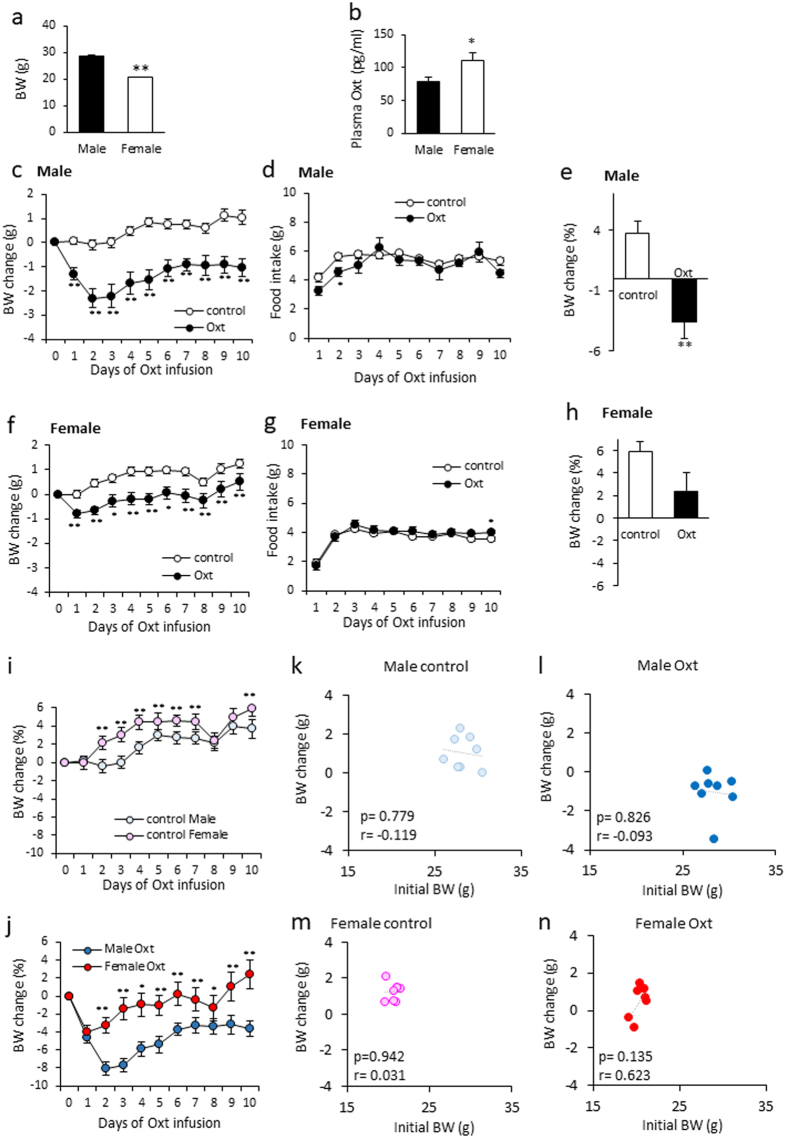
Figure 3.
The effect of Oxt treatment on BW and food intake in male and female mice fed a standard-chow diet. (a) Initial body weight of males and females used in this study. (b) Plasma Oxt levels in standard chow-fed male and female mice (n = 10 each). (c,d) Daily change of BW change (c) and food intake (d) during the infusion period in standard chow-fed male mice. (n = 8 each). (e) The percentage of BW change at 10 days after starting Oxt infusion in male mice. **P < 0.01 by unpaired Student’s t-test. (f,g) Daily change of BW change (f) and food intake (g) during the infusion period in standard chow-fed female mice. (n = 7, 8) *P < 0.05, **P < 0.01 by two-way ANOVA followed by Tukey’s multiple range test. (h) The percentage of BW change at 10 days after starting Oxt infusion in male mice. P = 0.068 by unpaired Student’s t-test. (i) The percentage of BW change during 10 days in control male and female. **P < 0.01 by two-way ANOVA followed by Tukey’s multiple range test. (j) The percentage of BW change during 10 days in Oxt treated male and female. *P < 0.05, **P < 0.01 by two-way ANOVA followed by Tukey’s multiple range test. (k,l) The correlation of BW change at 10 days and initial BW (BW at day0) in the control (k) and Oxt-treated (l) male mice. (m,n) The correlation of BW change at 10 days and initial BW (BW at day0) in the control (m) and Oxt-treated (n) female mice.

