
Figure 2.
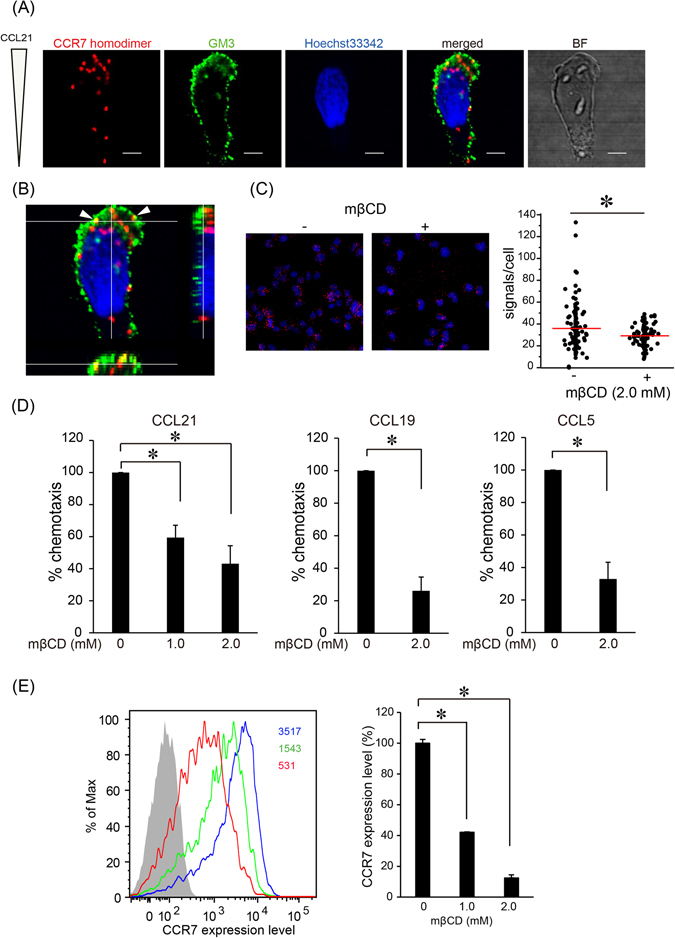
CCR7 homodimers are polarized toward GM3-enriched leading edge during CCR7-dependent cell migration. (A) The localization of CCR7 homodimers in T cell migration in response to CCL21 is shown (Red; PLA signal, Green; anti-GM3 antibody, Blue; Hoechst 33342). T cells were loaded into each well of the EZ-TAXIScan microchamber. After cell alignment was complete, human CCL21 (100 ng) was applied to the contra-wells. During migration, cells were fixed and stained with anti-human CCR7 antibody conjugated with the complementary oligonucleotide probes, anti-GM3 antibody, and Hoechst 33342. Scale bar: 10 μm. (B) Orthographic projection of the cell shown in (A). The center image illustrates a cross-sectional image (XY-plane), whereas the images to the right and below illustrate those in the YZ-plane and XZ-plane, respectively. White arrowheads show CCR7 homodimers detected in the GM3-enriched lipid rafts. (C) CCR7 homodimer formation after treatment with or without 2 mM MβCD was examined by in situ PLA (Red; PLA signal, Blue; Hoechst 33342). The number of PLA signals per cell was counted using the Duolink Image Tool software. The results shown are from one experiment, representative of three independent experiments, with the mean number of the signals plotted on the vertical axis. *p < 0.05 by Mann-Whitney’s U test. (D) Chemokine-induced cell migration with or without MβCD was examined using the Transwell assay. The indicated chemokine was added to the lower wells, and H9 cells were added to the upper wells in the presence of the indicated concentrations of MβCD. The results shown are from one experiment, representative of three independent experiments. Data represent mean ± SD of triplicate wells. *p < 0.05 by Student’s t test. (E) CCR7 expression levels were examined in the presence (red open histogram; 2 mM, green open histogram; 1 mM) or absence (blue open histogram) of MβCD by flow cytometric analysis using anti-human CCR7 antibody. The gray-filled histogram represents staining with isotype control antibody (left). The relative MFI of CCR7 expression is shown (right). The results shown are from one experiment, representative of three independent experiments. Data represent mean ± SD of triplicate samples. *p < 0.05 by Student’s t test.