Fig. 3.

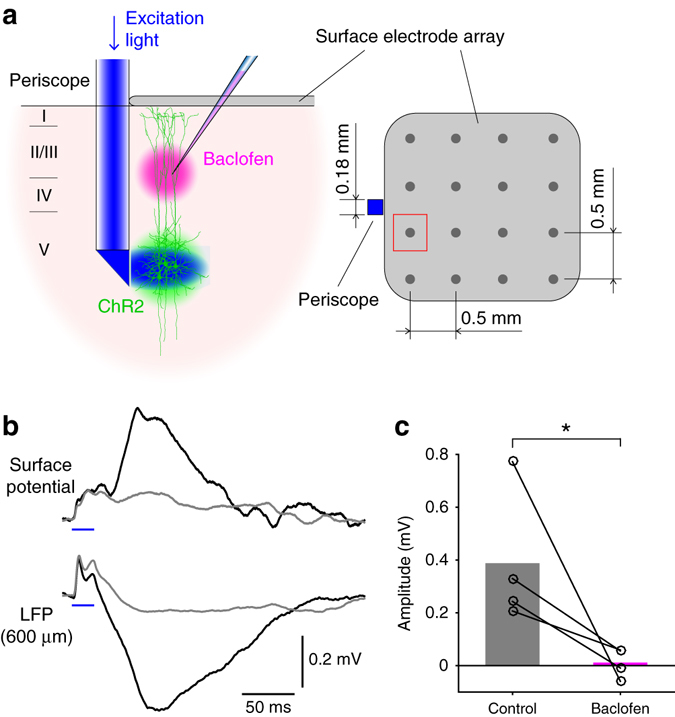
Optogenetically evoked dendritic Ca2+ spikes greatly affect surface potentials. a Schematic diagram of the experiment. Surface potentials recorded at the electrode close to the micro-periscope (marked in red) were analyzed. b Surface potentials generated by optogenetically evoked Ca2+ spikes (top) aligned with LFPs recorded at 600 μm below the pia (bottom). Black and gray traces (average of 10 measurements) are with and without discernable Ca2+ spikes, respectively. c Average surface potentials before and after application of 50 μM baclofen into L2/3 (n = 4, p < 0.05, Wilcoxon signed-rank test)
