Fig. 6.

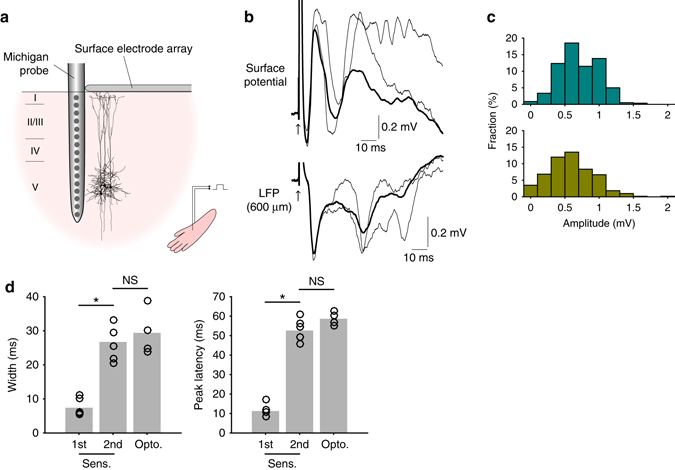
Sensory-evoked dendritic Ca2+ spikes also greatly affect surface potentials. a Schematic diagram of apparatus for recording sensory-evoked surface potentials. b Surface potentials aligned with LFPs recorded at 600 μm below the pia. Thick lines denote the average over 10 measurements; thin lines show representative traces where the late sink is as large as the first. c Surface positive potentials evoked by the first sink (top) and those evoked by the late sink (bottom). Pooled data from all rats (n = 6). d Width and peak latency of the first and second spikes evoked by sensory stimulus, compared to optogenetically evoked late spike
