Fig. 7.

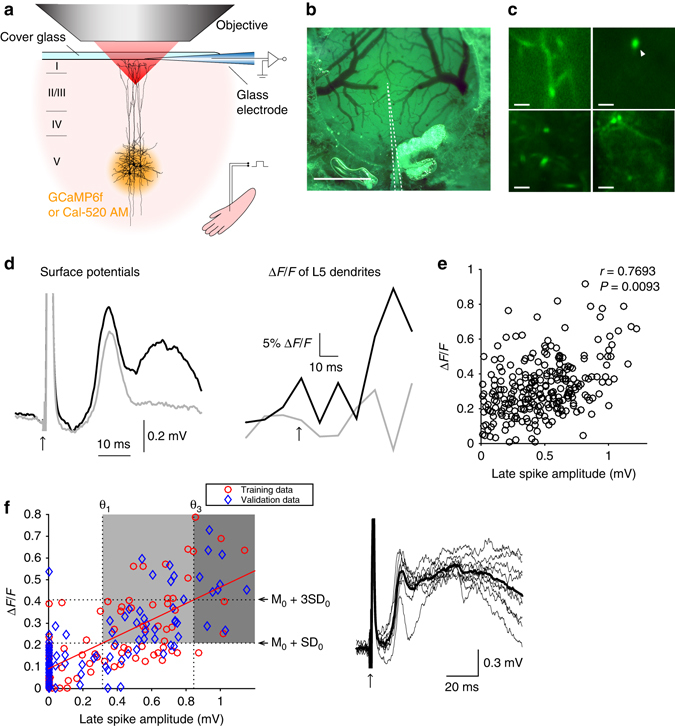
Two-photon Ca2+ imaging of individual dendrites and simultaneous recording of surface potentials. a Schematic diagram of the experiment. b Top view of the craniotomy. The dotted lines outline the recording glass electrode under the cover glass. Scale bar represents 1 mm. c Snapshots of imaged dendrites of L5 pyramidal neurons. Scale bars represent 10 μm. d Simultaneously recorded surface potentials (left) and Ca2+ transients (right) in the dendrite pointed by the arrow head in c. Black and gray traces (average of 20 measurements) are with and without discernable late spikes, respectively. e Strong correlation between the amplitude of surface potential and peak fluorescence change during the late spike (n = 38 dendrites from four animals). f Distribution of training and validation data points from correlated (r > 0.8) paired measurements (left). A lower threshold θ1 of 73.9% (34/46) accuracy was derived from the intersection of the horizontal line (M0 + SD0) with the fitted line to the training data (M0 and SD0 are, respectively, the mean and the standard deviation of the fluorescence change when surface potentials are zero). A higher threshold θ3 of 100% (10/10) accuracy was derived from the intersection of the horizontal line (M0 + 3SD0) with the fitted line. The classifier was applied to the validation data (blue). Right: the mean surface potentials in the dark gray area (thick line) and individual traces (thin lines)
