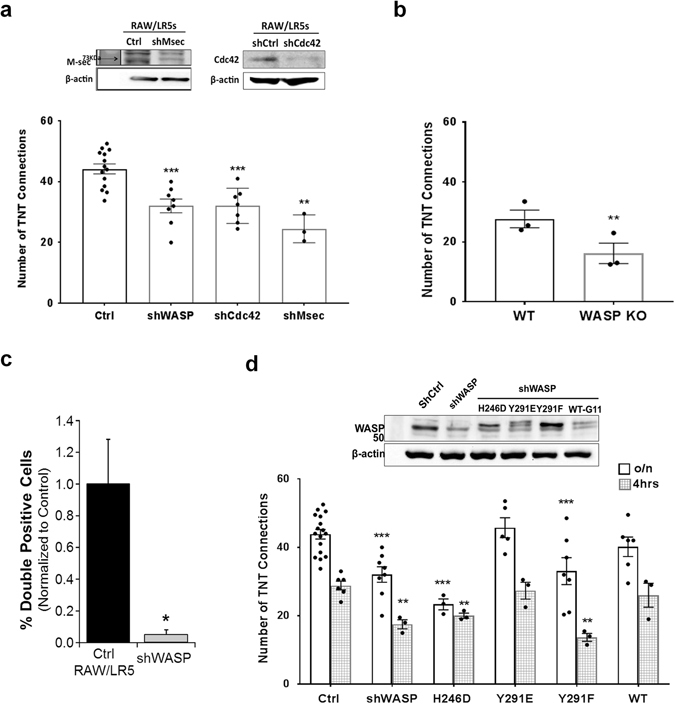
Figure 7.

Actin nucleation promoting factor WASP and its regulation are required for TNT formation. (a) Control RAW/LR5 macrophages or cells with stably reduced levels of WASP, Cdc42, or M-sec proteins using shRNA constructs. Western blot analysis shows the corresponding expression levels of M-sec (left) and Cdc42 (right) of the cell lines, β-actin is used as a loading control. Cells were plated in complete growth medium and TNTs were allowed to form overnight before quantitation. Data is represented as in the previous figures and represents the mean average of at least 3 independent experiments for each case. Error bars +/−SEM with **p < 0.02, ***p < 0.003. (b) TNT formation was quantified in WT bone marrow derived macrophages (BMMs) or WASP Knockout (KO) BMMs isolated from 3 independent mice. Error bars +/−SEM with *p < 0.01. (c) Dil-labeled cells were co-cultured with GFP containing cells for 24 hours. Transfer of DiI labeled material was quantitated using Flow cytometry and the % cells that have transferred DiI material (double positive cells) is shown. (d) Control RAW/LR5 macrophages, shWASP, and shWASP cells expressing mutant forms of WASP: a Cdc42-binding deficient (H246D) mutant, a phospho-mimetic (Y291E) mutant, a phospho-deficient (Y291F) mutant or a Wild-type (WT) form of WASP were used to quantify TNT formation. Upper panel shows western blot analysis for the expression levels of the corresponding cell lines used; β-actin is used as a loading control. TNT formation in the corresponding cell lines was quantitated overnight (clear bars) and at 4hrs (gray pattern bars) following quick plating. Data is presented as dot plots of values from individual experiments and as outlined histograms of the mean average of at least 3 independent experiments. Error bars +/−SEM with *p < 0.05, **p < 0.01, ***p < 0.001.
