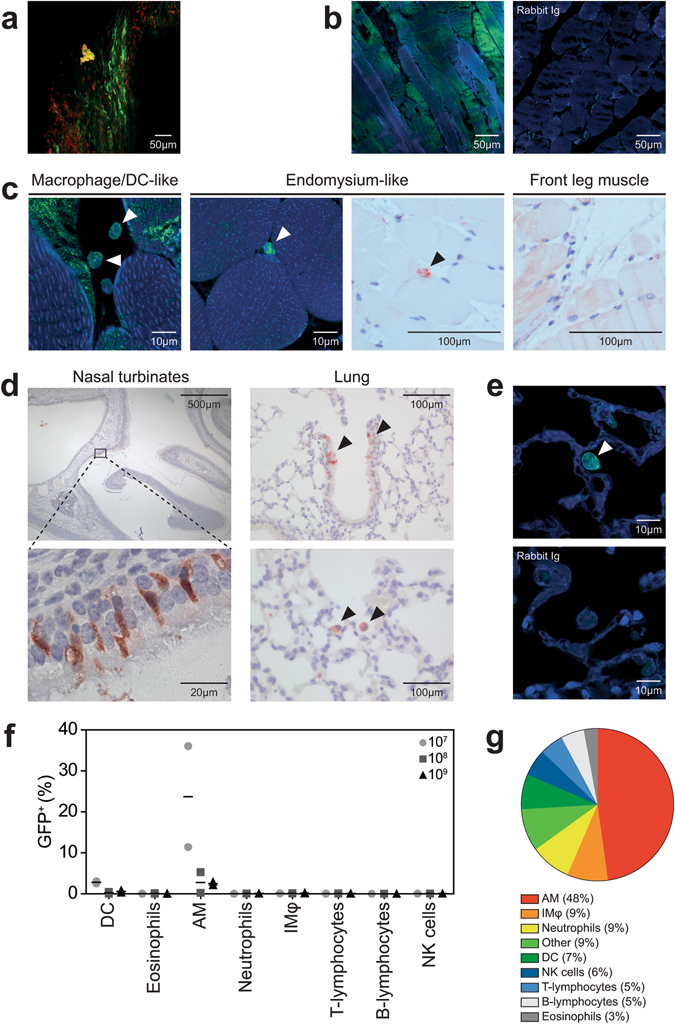
Figure 3.

GFP+ cells in muscle or respiratory tract after IM injection or IN instillation of rMVA-GFP to mice. (a) Maximum intensity projection of a Z-stack of the hind leg muscle 24 h after IM injection of rMVA-GFP. Green = GFP. Red = nucleus (stained by TO-PRO3). (b) Detection of GFP+ myocytes in hind leg muscle tissue after IM rMVA-GFP injection by staining with rabbit anti-GFP or rabbit Ig isotype (green) in combination with DAPI (blue). (c) Morphological characterization of GFP+ cells in hind leg muscle tissue after IM rMVA-GFP injection by CLSM (left two panels) or IHC (right two panels) showing hind leg muscle (24 HPA) or negative control front leg muscle (6 HPA). GFP+ interdigitating cells are indicated by arrows. CLSM: GFP = green, nucleus = blue (DAPI). IHC: GFP = red and counterstaining with haematoxylin. (d) Detection of GFP+ cells in the nasal turbinates and lungs 6 or 24 h after IN instillation of rMVA-GFP. GFP+ cells are shown in red (indicated by arrows). Tissues were counterstained with haematoxylin. (e) Morphological characterization of GFP+ cells in lungs after IN instillation of rMVA-GFP by staining with rabbit anti-GFP or rabbit Ig isotype (green) in combination with DAPI (blue). GFP+ cell with macrophage-/DC-like morphology is indicated by arrow. (f) Percentage of GFP+ cells within different cell populations 6 h after IN instillation of 107, 108 or 109 PFU rMVA-GFP determined by flow cytometry. Results are shown as mean of two mice. (g) Relative contribution of the different cellular subsets to the GFP+ population by reversed gating. The average percentages of all mice that received rMVA-GFP by IN instillation and were euthanized 6 HPA are shown. IMφ = interstitial macrophages. Contrast of some CLSM images have been linearly enhanced using Adobe Photoshop CC. Scale bars are indicated in each figure.
