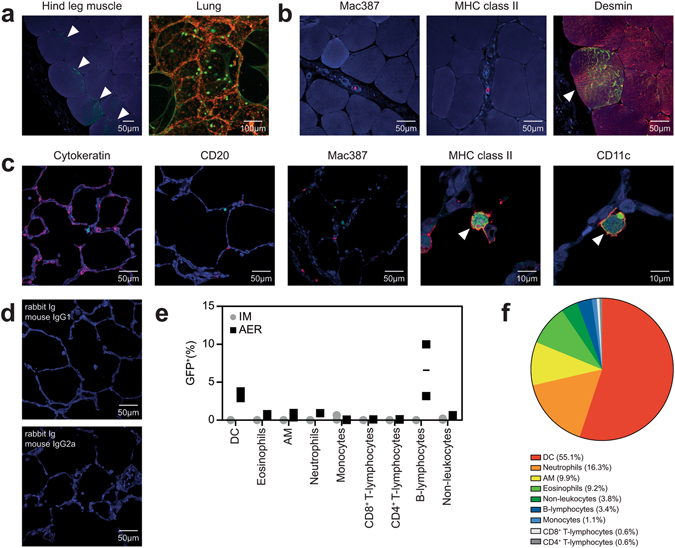
Figure 6.

Identification of rMVA-GFP+ cells in macaque muscle or lung after IM injection or AER inhalation, respectively. (a) Detection of GFP+ cells at site of rMVA-GFP administration. Left panel: hind leg muscle after IM injection stained with rabbit anti-GFP (green, indicated by arrows) and DAPI (blue). Right panel: direct detection of GFP fluorescence in lung slices after AER inhalation counterstained with TO-PRO3 (red). Maximum intensity projection of a Z-stack is shown. (b) Dual immunofluorescent staining of muscle slices after IM injection of rMVA-GFP with rabbit anti-GFP (green) in combination with DAPI (blue) and mouse anti-Mac387, anti-MHC class II or anti-desmin (red). Co-localization of GFP and desmin is indicated by an arrow. (c) Dual immunofluorescent staining of lung slices after AER inhalation of rMVA-GFP with rabbit anti-GFP (green) in combination with DAPI (blue) and mouse anti-cytokeratin, anti-CD20, anti-Mac387, anti-MHC class II or anti-CD11c (red). Co-localization of GFP and MHC class II or CD11c is indicated by arrows. (d) Lung slices stained with isotype control antibodies (rabbit Ig as control for anti-GFP, mouse IgG1 and 2a as control for cytokeratin, CD20, Mac387, MHC class II, CD11c, CD3 and desmin). (e) Percentage of GFP+ BAL cells within different cell populations after IM injection or AER inhalation of rMVA-GFP determined by flow cytometry. Mean of two macaques is indicated. (f) Relative contribution of the different subsets to the GFP+ population determined by reversed gating. The averages of the two animals that received rMVA-GFP by AER are shown. Contrast of some CLSM images has been enhanced linearly using Adobe Photoshop CC. Scale bars are indicated in images.
