Fig. 4.
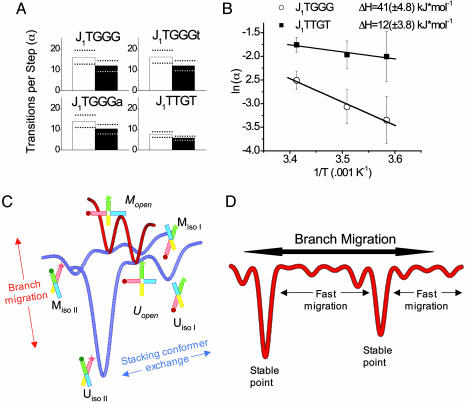
Branch migration energy landscape. (A) The number of conformational transitions occurring before a migration step takes place (α) is approximately constant for G-C base pairs, but the value is halved for an A-T base pair. Empty bars represent the α value for slow-to-fast state transitions, and filled bars represent the α value for fast-to-slow transitions. (B) Arrhenius plot showing the dependence of the rate of branch migration on temperature. Note that the activation enthalpy for branch migration requiring the breakage of a G-C base pair (J1TGGG) is nearly three times that for an A-T pair (J1TTGT). (C) Illustrative scheme showing the important states and energy barriers for a single-step junction. Although open states are depicted, they are too short-lived for direct experimental observation in the presence of Mg2+ ions. Note that the open state is a common intermediate for both conformer exchange and branch migration. (D) Long-range branch migration will be a very uneven process, reflecting a rugged energy landscape. The data from junctions of different sequence indicate that the lifetimes of individual stacking conformer lifetimes vary markedly, thereby trapping junctions in particularly stable step positions while moving relatively rapidly through stretches of less stable positions.

