Figure 4.
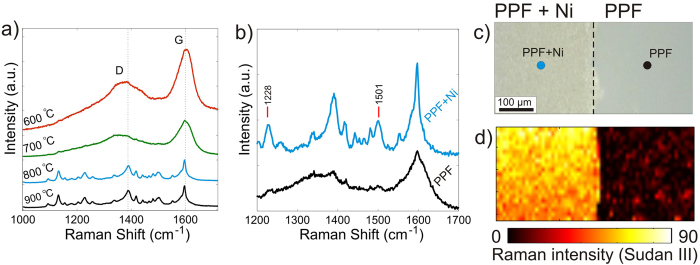
GERS spectra of Sudan III molecule. (a) The PPF+Ni process temperature dependence to the resulting GERS enhancement shows remarkable difference between sample fabricated at 700 °C and 800 °C. (b) Raman spectra for the PPF+Ni and PPF fabricated at 800 °C (averaged over the substrate surface). (c) Optical microscope image showing the boundary between PPF+Ni and PPF. (d) Mapping of the Sudan III Raman peak at 1228 cm−1 at the boundary between PPF+Ni and PPF substrates. In both (a and b) the spectra have been displaced for clarity.

