
Figure 5.
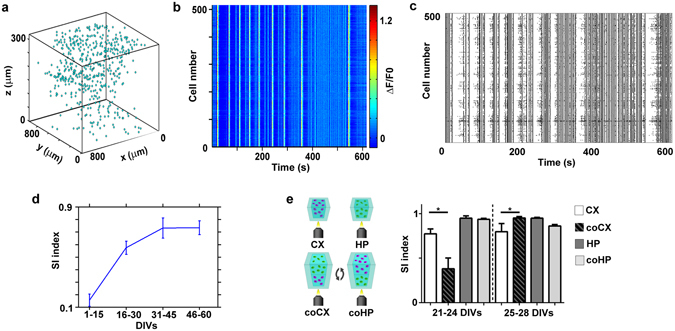
Structural and functional reconstruction of a representative 3D cortical network. (a) 3D representation of the cell somata positions, within the acquired volume portion of the 3D cortical neuronal network at 24 DIVs; (b) ΔF/F pseudo-color plot of the identified cells of the network shown in a). (c) raster plot of the same network as in a) and b) constructed after the automated calcium event detection analysis. (d) Plot showing the synchronicity index (SI) of 3D cortical cultures over time; data shown are the mean values ± standard errors (n = 17 for each group of DIVs); (e) On the left, a scheme of the optical monitoring layout of the compared conditions is shown (CX = cortical network analyzed in single cultures, HP = hippocampal network analyzed in single cultures, coCX = cortical network analyzed in layered co-cultures, coHP = hippocampal network analyzed in layered co-cultures). On the right, bar plot showing the synchronicity index (SI) of single and layered co-cultures at early and late DIVs; data shown are the mean values + standard errors (n = 7 for each group at 21–24 DIVs, and n = 13 for each group at 25–28 DIVs). Note that the data were grouped differently than in Fig. 4 to facilitate the comparison among different preparations (e.g. we managed to record only one co-culture at 36 DIVs).