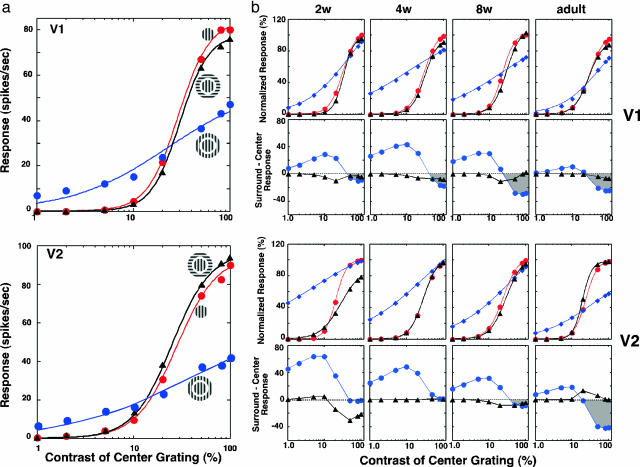
Fig. 6.
Developmental changes in center/surround interactions as a function of center stimulus contrast. (a) Center/surround interactions in representative units from V1 (Upper) and V2 (Lower) of an adult monkey. Contrast-response functions are illustrated for center only (red), center plus isooriented surround (blue), and center plus orthogonal surround (black). Responses are fitted into a hyperbolic function [R = RmC[supi]n/(C50[supi]n + Cn), in which C is the stimulus contrast, Rm is the maximum response, C50 refers to the stimulus contrast that elicits half the maximum response, and n, the exponent, signifies the rate at which response changes occur]. (b) Contrast-dependent center/surround interactions in infant and adult monkeys. (Top row) Normalized responses of V1 neurons as a function of center contrast for center only (red), center plus isooriented surround (blue), and center plus orthogonal surround (black). Surround contrasts were kept at 80%. The representative unit for each age group was chosen based on the median value of n, C50, and Rm of hyperbolic functions. (Second row) Differences (center/surround responses) between center only and center plus isooriented surround (filled circles) or between center only and center plus orthogonal surround (filled triangles). Positive values indicate facilitative center/surround interactions, and negative values indicate inhibitory interactions. (Third row) Comparable functions for representative V2 units as a function of age. (Bottom row) Comparable difference functions for V2 units.

