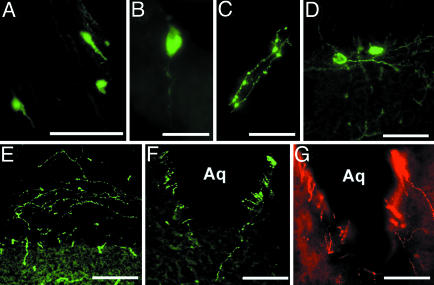
Fig. 2.
Distribution of GnRH soma and fibers in the brain of EGFP+/GnRH1 rats is shown. (A) TT. (B and C) Soma (B) and fibers (C) in the HB. (D and E) Soma (D) and fibers (E) in the MM. (F and G) EGFP+/GnRH1 fibers (F) and Cy3-labeled GnRH2 fibers (G) surrounding the Aq in the midbrain. (Scale bars: A and D–G, 100 μm; B and C, 50 μm.)

