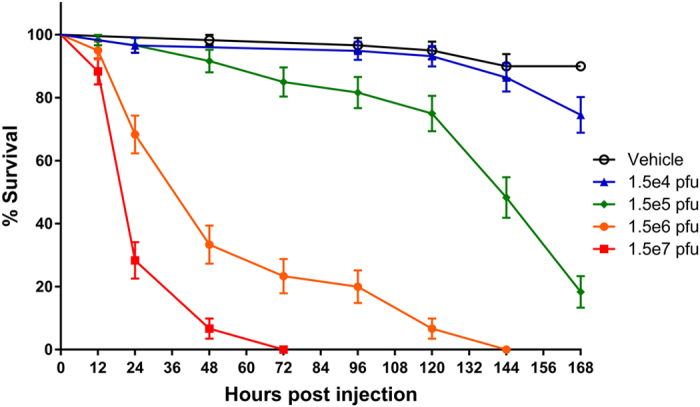
Figure 1.

Honey bee survival following infection with increasing titers of FHV. Data presented as Kaplan-Meier survival curves with points representing mean values ± standard error for 150 bees (6 replicate groups of 25 adult bees). Groups receiving 1.5 × 10⁵ pfu of FHV/bee or more experienced significantly higher mortality than vehicle control group (Kaplan-Meier log-rank test; P < 0.0001). Data analyzed using GraphPad Prism 7 software.
