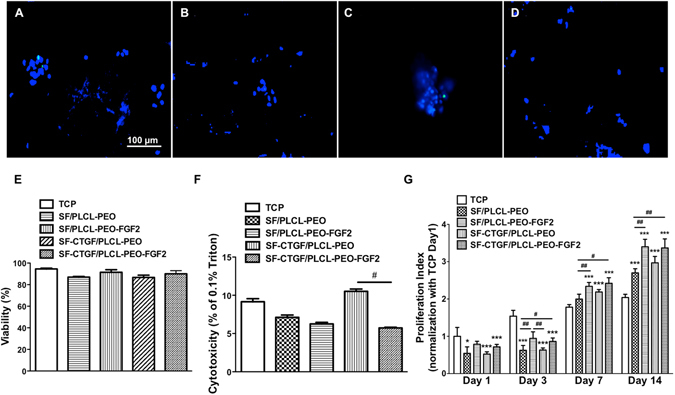
Figure 4.

Analysis of biocompatibility of different coaxial scaffolds. (A–D) Representative images of live-dead staining of rMSCs after 1 day culture on different scaffolds SF/PLCL-PEO (A), SF/PLCLPEO-FGF2 (B), SF-CTGF/PLCL-PEO (C) and SF-CTGF/PLCL-PEO-FGF2 (D). All cells were counterstained with NucBlue live reagent, nuclei of dead cells were counterstained with NucGreen dead reagent. (E) The quantified data from (A–D), at least 200 cells were counted for each group. (F) Analysis of cytotoxicity of different scaffolds to rMSCs after 1 day culture by LDH assay. (G) Analysis of rMSCs proliferation on different scaffolds after a 14-day incubation by CCK assay. (One-way repeated-measure Analysis of Variance test (ANOVA) were used to compare multiple groups. * and *** stand for significant difference between samples on scaffolds and samples on tisue culture plastic (TCP) at same time point with p < 0.05 and p < 0.001, respectively; # and ## stand for significant difference among different scaffolds at same time point with p < 0.05 and p < 0.01, respectively).
