
Figure 2.
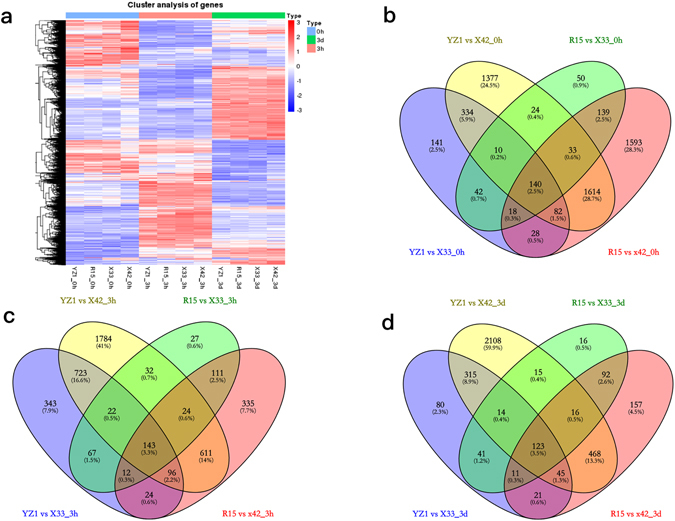
DEGs in three same-stage comparisons between HD and LD. (a) Heatmap of DEGs (P-value < 0.05, |log2FoldChange| > 2 at one sampling point); (b–d) Venn analysis of the DEGs in two types of cotton during three time stages.
Official websites use .gov
A
.gov website belongs to an official
government organization in the United States.
Secure .gov websites use HTTPS
A lock (
) or https:// means you've safely
connected to the .gov website. Share sensitive
information only on official, secure websites.
DEGs in three same-stage comparisons between HD and LD. (a) Heatmap of DEGs (P-value < 0.05, |log2FoldChange| > 2 at one sampling point); (b–d) Venn analysis of the DEGs in two types of cotton during three time stages.