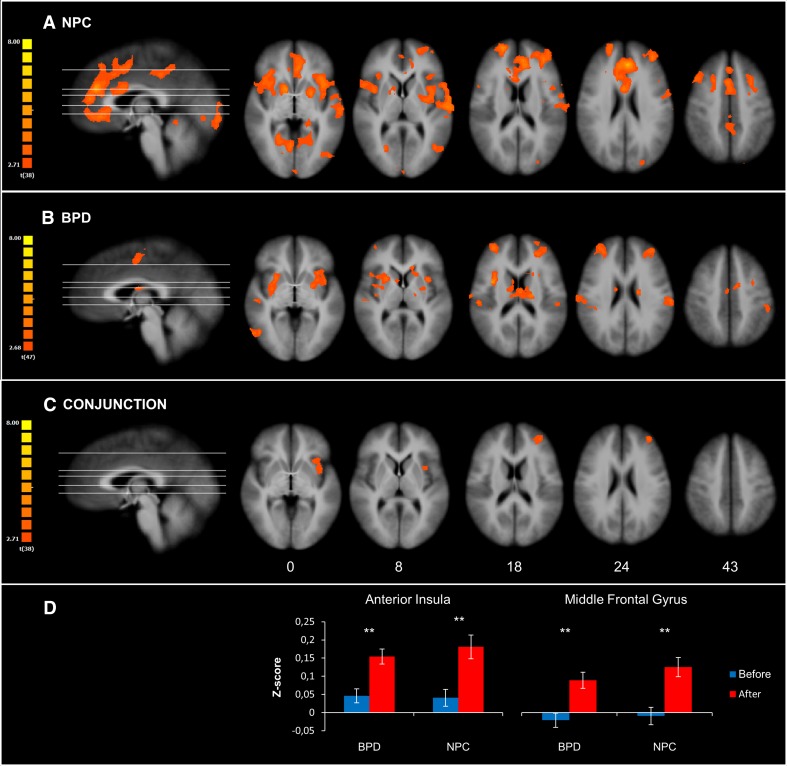
Fig. 2.
Change in the functional connectivity after the emotion regulation task. a Depicts the change in the amygdala resting-state functional connectivity in the NPC group, whereas b depicts the change in BPD patients. c Depicts the results of the conjunction analysis to indicate a common network of the change in the amygdala resting-state functional connectivity for both groups. d Depicts bar plots of the mean z-score (±SEM) of the clusters resulting from the conjunction analysis. The t-maps were corrected at the cluster level (p = 0.05; k = 1134, 891, 837 mm3 for the map of NPC, BPD, and conjunction, respectively) and overlaid on an anatomical image averaged over all participants in the Talairach standard space, according to the radiological convention. The hot colors indicate increased resting-state functional connectivity of the amygdala after the task. Numbers in the bottom row indicate z-coordinates of the axial sections in the Talairach standard space

