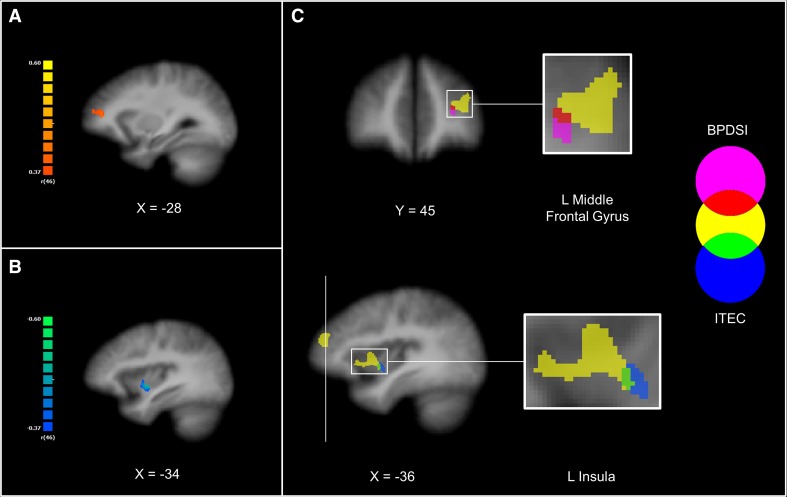
Fig. 4.
Correlational analyses of the change in the functional connectivity and BPD characteristics. a Depicts the correlation analysis between the magnitude of change in the amygdala resting-state functional connectivity after the task and the severity of the BPD psychopathology (BPDSI). b Depicts the correlation analysis with the severity of the reported childhood traumatic events (ITEC). The r-maps were corrected at the cluster level (p = 0.05; k = 270 and 351 mm3 for the map of BPDSI and ITEC, respectively) and restricted to the mask of the network that showed significantly increased resting-state functional connectivity of the amygdala after the task in the BPD group (see “Methods and materials”). Positive association is shown in hot colors, whereas cold colors indicate negative association. c The two r-maps were overlaid with the map of the conjunction analysis (see “Methods and materials”), which is depicted in yellow. Statistical maps were overlaid on an anatomical image averaged over all participants in the Talairach standard space, according to the radiological convention

