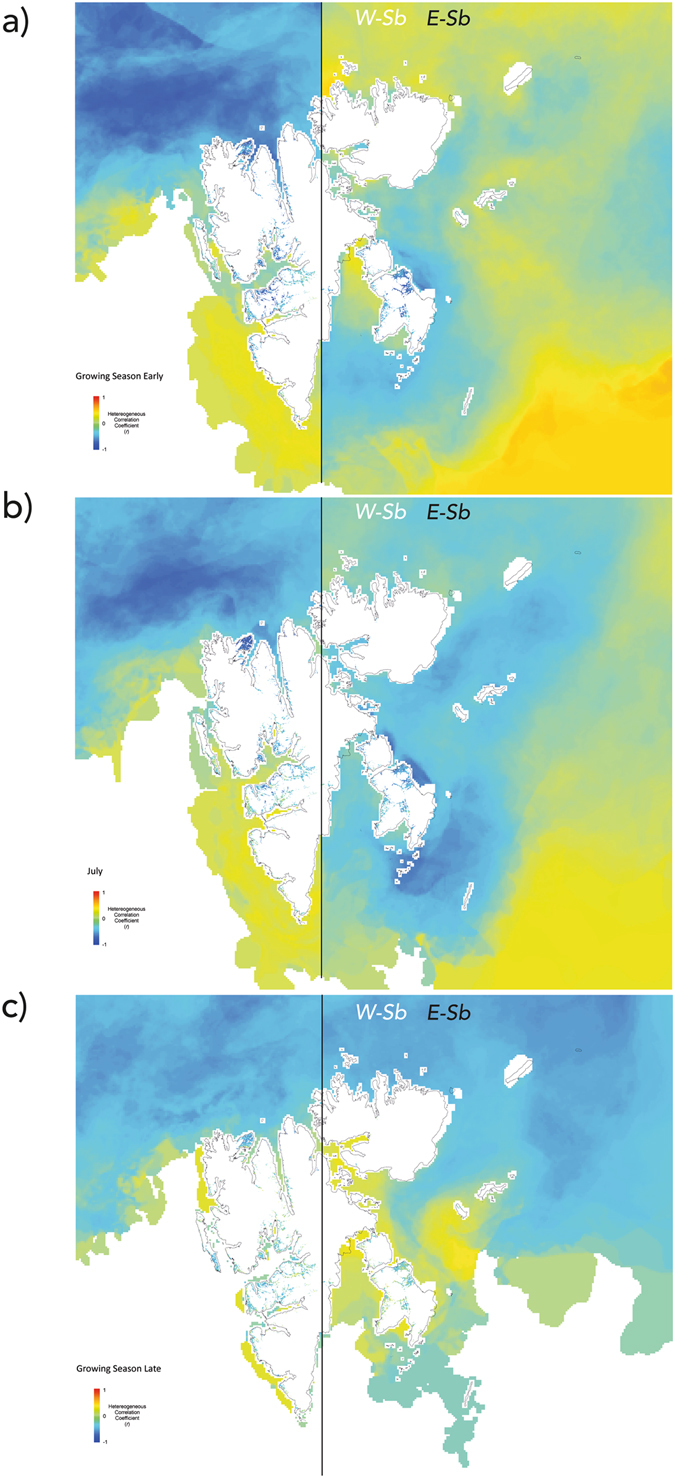
Figure 1.

Heterogeneous Correlation Maps. Heterogeneous Correlation Maps between sea ice concentration and Normalised Difference Vegetation Index (NDVI) anomalies for the 1st Singular Value (SV) during (a) the Early Growing Season (EGS; June 10 – July 4); (b) the Peak of Growing Season (JL; June 26 – August 5); and (c) the Late Growing Season (LGS; August 5 – September 6, see Methods) for the West (left panel) and East (right panel) halves of the Svalbard Archipelago. Land pixels show the correlation between observed NDVI (period 2000–2014) and the expansion coefficients of Sea Ice for the 1 st SV; Ocean pixels show the correlation between observed Sea Ice concentration (period 2000–2014) and the expansion coefficients of NDVI for the 1 st SV. Maps were generated using Matlab (version R2016b; https://www.mathworks.com) and ArcMap (version 10.2; https://www.esri.com), used herein under license.
