
FIG 4.
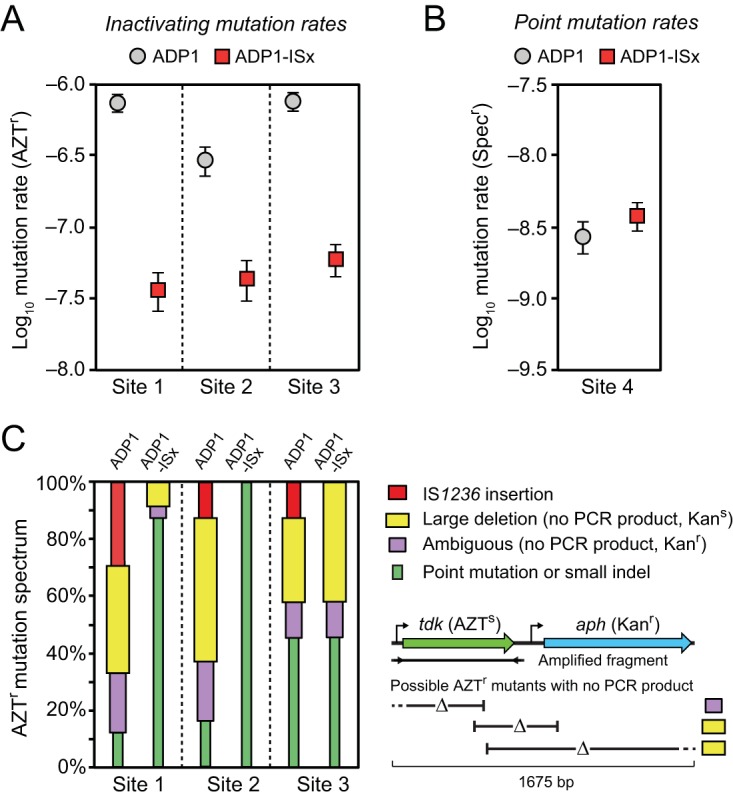
Reduced rates of inactivating mutations in ADP1-ISx. (A) Rates of mutations leading to loss of function of a counterselectable marker gene (tdk) were determined using fluctuation tests that selected for resistance to azidothymidine (AZTr). The error bars are 95% confidence intervals. The marker was placed at three different sites in the A. baylyi genome that differed in how near they were to IS1236 elements in the wild-type ADP1 genome (Fig. 2A). (B) Mutation rates were measured for reversion of a stop codon in the leader region of an antibiotic marker gene that restored spectinomycin resistance (Specr). This assay is expected to primarily reflect the point mutation rate. The error bars are 95% confidence intervals. (C) Spectrum of inactivating mutations determined by using PCR to amplify a fragment containing the tdk gene from the genome of one AZTr mutant from each of the 24 biological replicates of the fluctuation tests in panel A. IS1236 mutations and point mutations were inferred from an expected size change or no size change in this fragment, respectively. When no PCR product resulted and the function of the adjacent aph marker gene that was inserted alongside the tdk gene was also lost (yielding a Kans versus a Kanr phenotype), then the inactivating mutation was inferred to be a large deletion. If there was no PCR product and the mutant remained Kanr, then it was likely a large deletion that overlapped the tdk gene but not the aph gene. However, since the PCR could have failed to amplify a band for other reasons, we conservatively classified this as an “ambiguous” result. This logic for classifying mutations is illustrated in the schematic below the legend and further explained in the text (see “Altered mutational spectrum in ADP1-ISx”). As expected, no IS1236 insertions were found in ADP1-ISx. The proportion of large deletions among the inactivating mutations was also greatly reduced at site 1 and site 2.