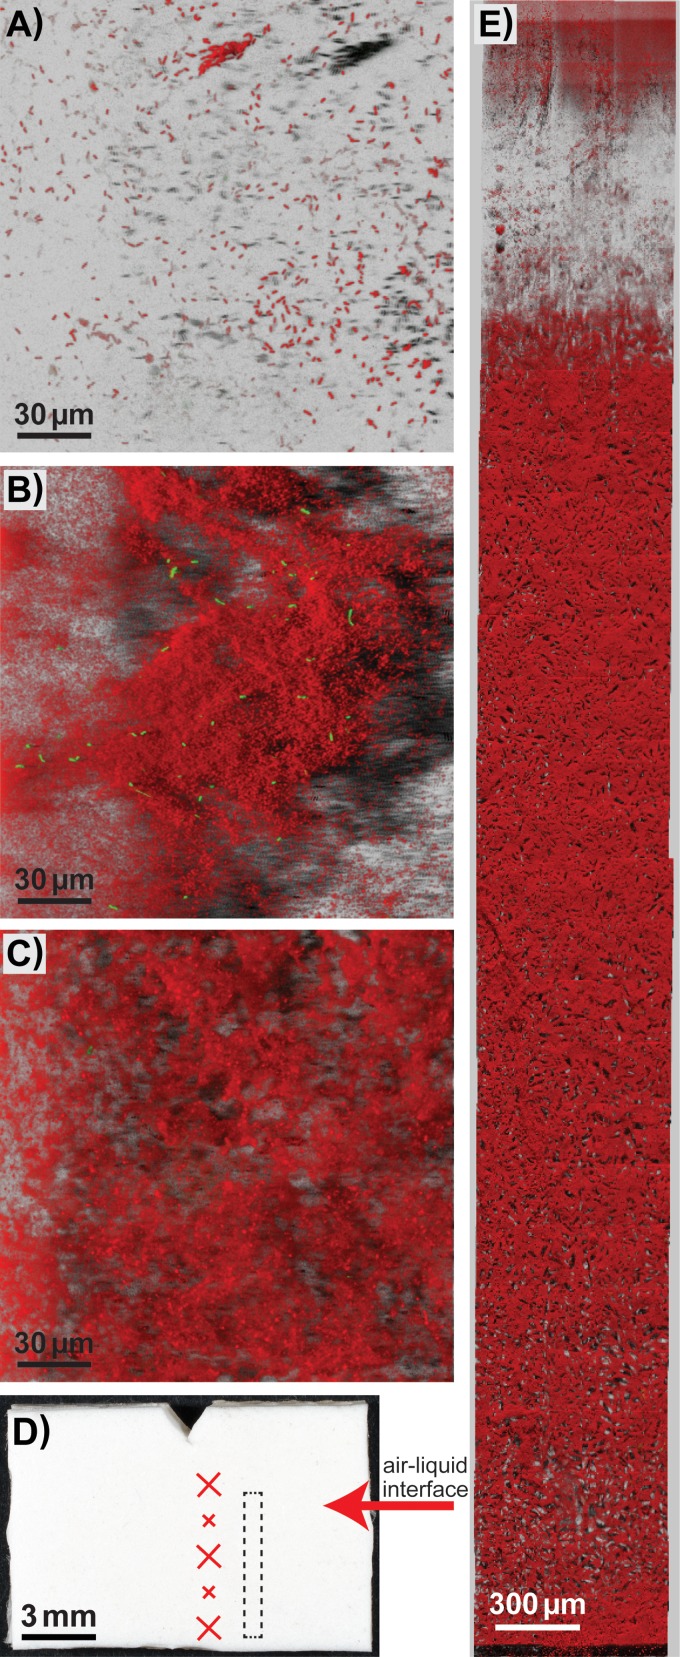
FIG 6.
Biofilms on the top coating of conveyor belt material examined using CLSM. Green represents GFP-expressing L. monocytogenes cells, while Acinetobacter and Pseudomonas background flora strains are shown in red. (A to C and E) CLSM images shown are Easy3D shadow projection reconstructions obtained from the confocal Z-stack series using the IMARIS software. Coupons with biofilms were imaged either on day 4 (B) or on day 7 (A, C, E) after initiation of biofilm growth and harvested after rinsing in H2O (C, E) or after C&D with QAC (A, B). (D) Photograph of the front side of a conveyor belt coupon. The arrow indicates the approximate location of the air-liquid interface during biofilm development, and crosses show the approximate locations on each coupon where the CLSM images were acquired (when only three images were acquired, the locations indicated by the large crosses were used). (E) Mosaic 3D meta-image obtained using a motorized stage that automatically moves the sample between scans and tiles the adjacent fields. The box drawn with dashed lines in panel D approximately corresponds to the area of the coupon covered by the CLSM image in panel E.

