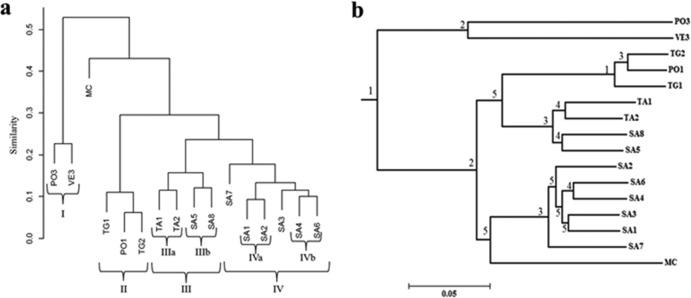
FIG 2.
Station clustering based on Bray Curtis dissimilarity (a) and the distance matrix generated by calculating pairwise UniFrac metrics (b). The scale bar in panel b shows the distance between clusters in UniFrac units; if two or more environments have similar lineages, they have a distance of 0. The significance of the cluster nodes was determined using the jackknife analysis. Jackknife significance values are >99.9% = 1, 90 to 99% = 2, 70 to 90% = 3; 50 to 70% = 4, <50% = 5, and higher values indicate a higher adaptation of communities to the existing environmental conditions.

