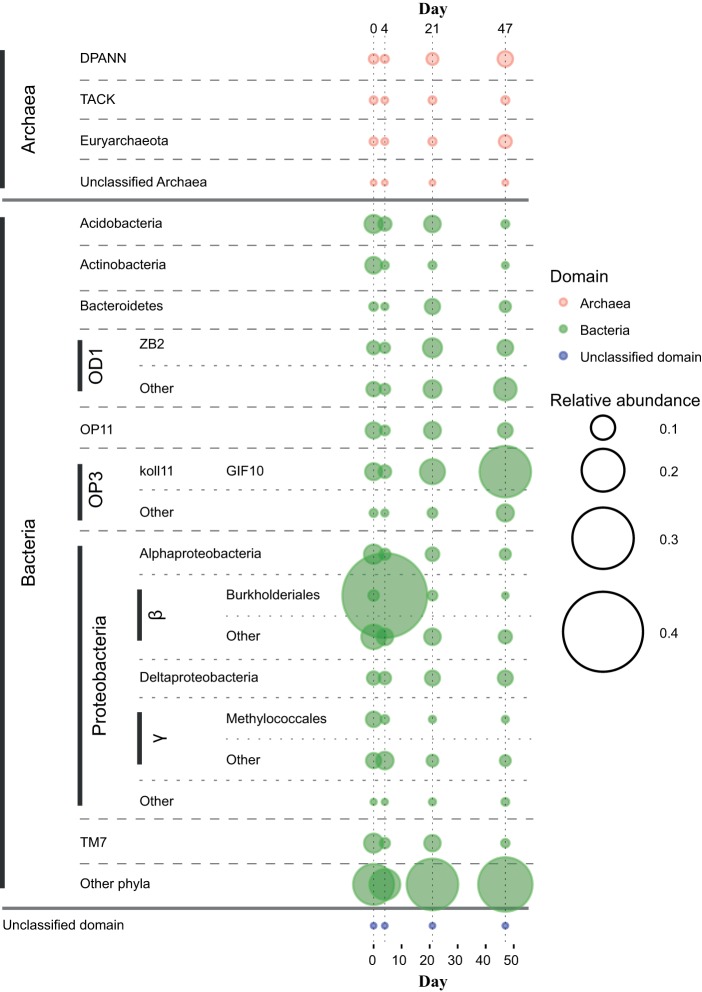
FIG 4.
Taxon relative abundances over time. Only taxa with an average relative abundance of >5% of the total sequences in at least a single sampling day are shown. Taxa with <5% of all sequences are grouped under “other.” Phyla with <5% of relative abundance at all times are grouped under “other phyla,” except Archaea.

