
FIG 3.
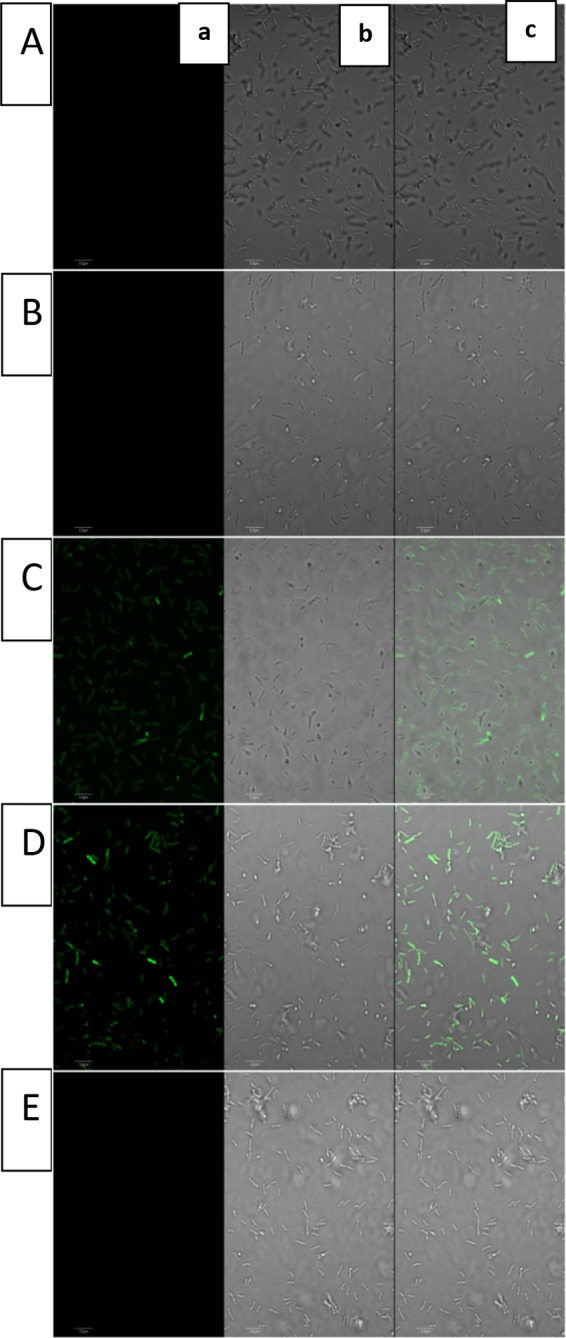
Fluorescence imaging of Lysobacter enzymogenes OH11, the Le-qseB deletion mutant, and the Le-qseC deletion mutant. (A) Strain OH11; (B) strain OH11 treated with compound 4 (the fluorophore alone); (C) strain OH11 treated with compound 1 (the fluorophore with the indole probe); (D) Le-qseB deletion mutant treated with compound 1; (E) Le-qseC deletion mutant treated with compound 1. Each of the picture panels shows a picture taken at a 488-nm excitation wavelength and a 509-nm emission wavelength (a), a picture taken under transmitted light (b), and a merged image of panels a and b (c).