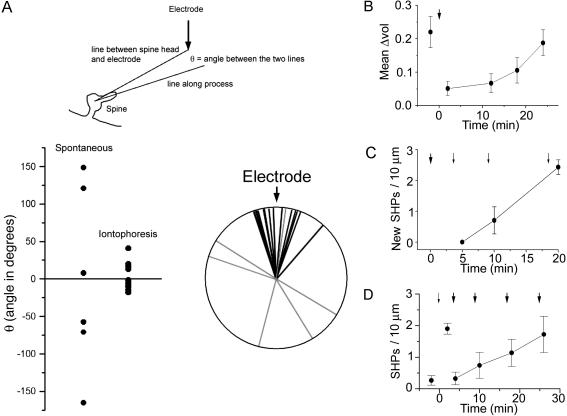
Fig. 4.
Additional properties of SHPs. (A) Schematic diagram indicating how the angle taken by a SHP was measured. A line was drawn from the center of the spine head to the position of the iontophoresis electrode. A second line was then drawn along the SHP, from the center of the spine head. The difference represents the angle Θ. (Lower) Data are plotted as scatter plots (Left) and radial plots (Right). Processes that formed in the absence of iontophoretic application of glutamate (light gray in the radial plot) show no directional tendency, whereas those that formed in response to glutamate (black in the radial plot) tended to point toward the iontophoresis electrode. This figure is a summary of 12 experiments. (B) Spine motility takes ≈20 min to recover after iontophoretic application of glutamate. Spine motility was measured as the fluctuation in individual spine volume from a mean value. A 200-nA glutamate pulse was applied as indicated by the arrow. (C) The formation of SHPs becomes refractory for 10-20 min after a strong glutamate pulse. A 200-nA pulse was applied at the time indicated by the bold arrow. A weaker pulse (100 nA) then was applied after a delay of 5, 10, or 20 min. (D) Progressive stabilization of SHPs. After a 100-nA glutamate pulse (small arrow), SHPs appear. Subsequent challenge with a 200-nA glutamate pulse (bold arrow) at 4, 10, 18, or 26 min after the weaker pulse reveals that SHPs can be destabilized but become progressively resistant to strong glutamate pulses over time. Data in all panels are from four to six slices per point.

