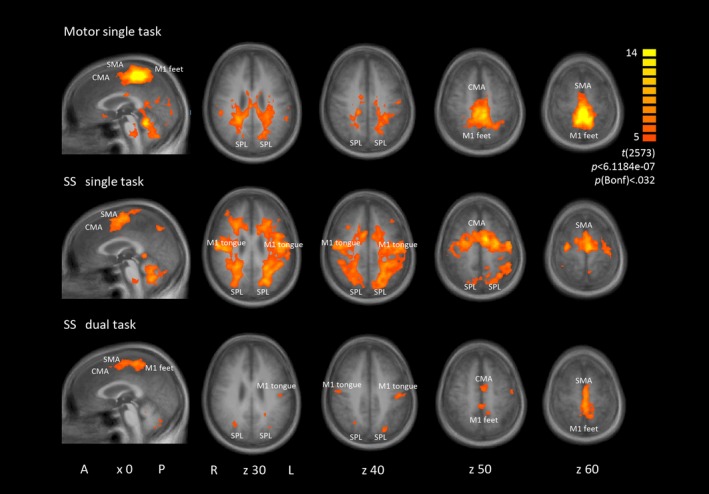
Figure 2.

Group activation maps rendered onto sagittal and transversal group average brain slices (A = anterior, P = posterior, L = left, R = right; x, z = TAL coordinates). Group contrast t value maps of task versus baseline for motor single task, serial subtraction (SS) single task and SS dual task. Similar activation maps were found for the verbal fluency single and dual task. ROIs: primary motor cortex (M1), supplementary motor area (SMA), cingulate motor area (CMA), superior parietal lobe (SPL)
