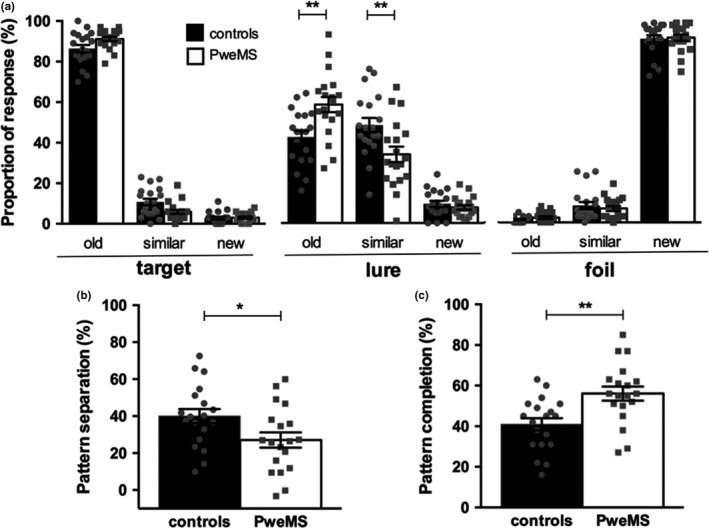
Figure 2.

Results of the Mnemonic Similarity Test (MST) in patients with early MS (PweMS) and healthy controls. a: Response accuracy during the test phase for each type of pictures/stimuli (“target”, “new” or “foil”). b and c: Pattern separation and pattern completion scores. Each dot represents a participant. Results are presented as mean ± SEM. *p < .05, **p < .01
