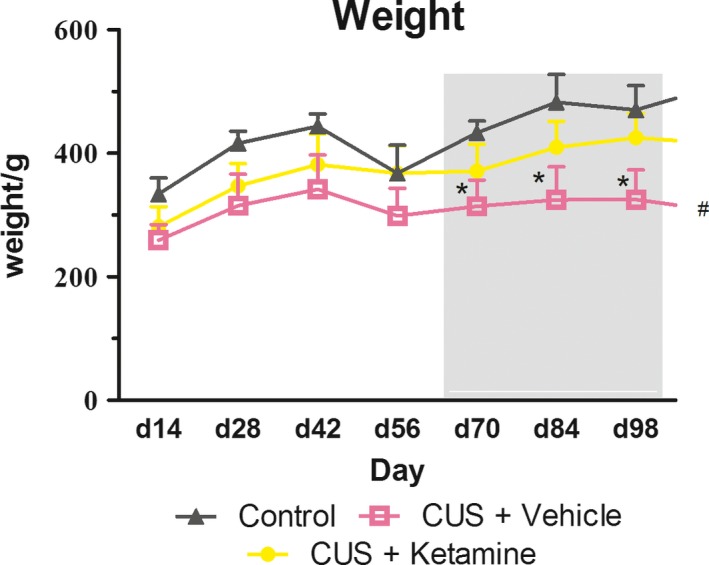
Figure 2.

The final body weights were expressed as the percentage of the body weights at 7‐day. As shown in the figure, the body weight tendency of “CUS + Ketamine (N = 10),” “CUS + Vehicle (N = 10),” and “Control (N = 8)” group rates were expressed in three different shapes of line, respectively. Figure in the gray area from long‐term efficacy of ketamine (experiment start days 63–112). Data are represented as body weight in grams and results were group means +standard deviations. *p < .05 were expressed between CUS + Ketamine and CUS + Vehicle group statistically significant. # p < .05 were expressed between Control and CUS + Vehicle group statistically significant
