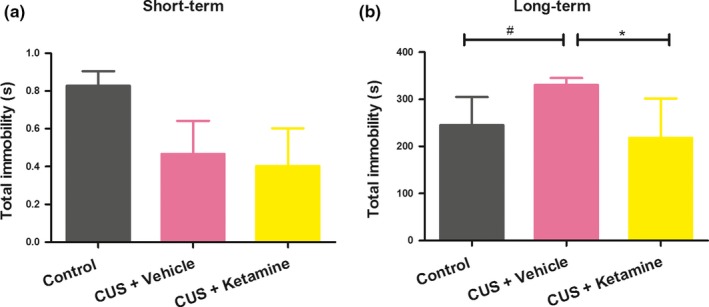
Figure 5.

(a,b) Short‐ and long‐term of total immobility time showed different results. The results were group means + standard deviations, “CUS + Ketamine (N = 8),” “CUS + Vehicle (N = 10),”and “Control (N = 8).” *p<.05 were expressed between CUS + Vehicle and CUS + Ketamine group statistically significant. # p < .05 were expressed between Control and CUS +Vehicle group statistically significant
