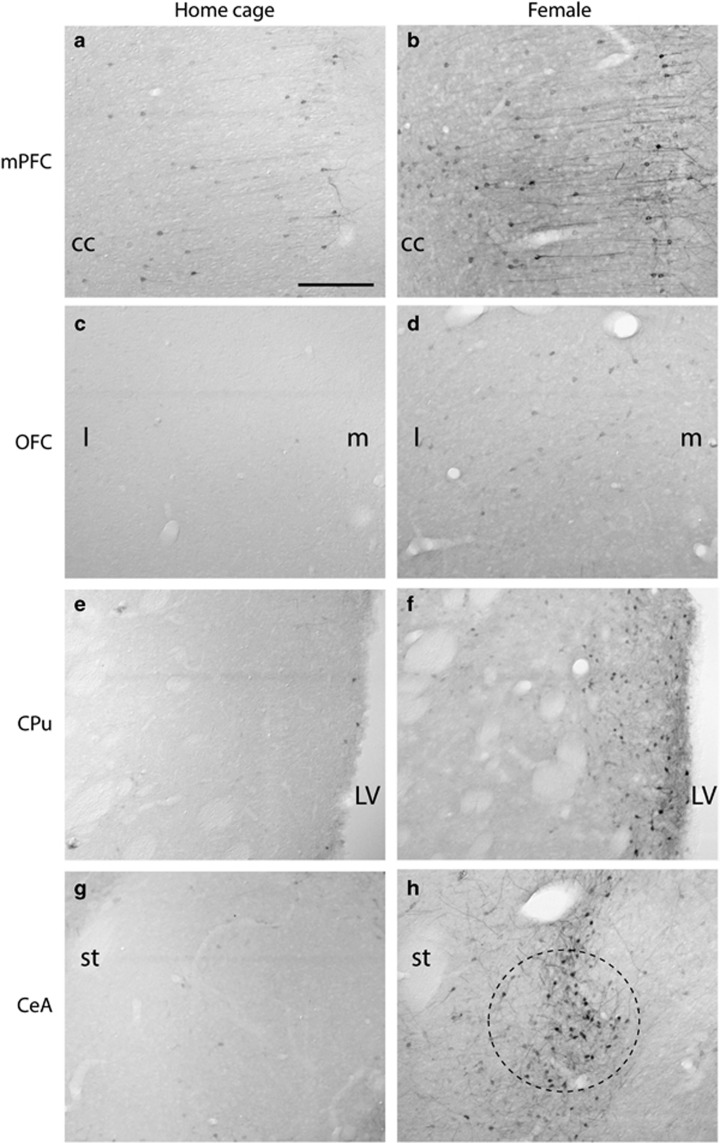
Figure 2.
Representative images of pERK expression in home cage control males (a,c,e,g) and following exposure to the conditioned aversive cue, ie, the female (b,d,f,h) in experiment 1. CeA, central amygdala; cc, corpus callosum; CPu, caudate putamen; LV, lateral ventricle; mPFC, medial prefrontal cortex; OFC, orbitofrontal cortex (l: lateral; m: medial); st, stria terminalis. Circle in h indicates location of CeA. Scale bar indicates 200 μm.

