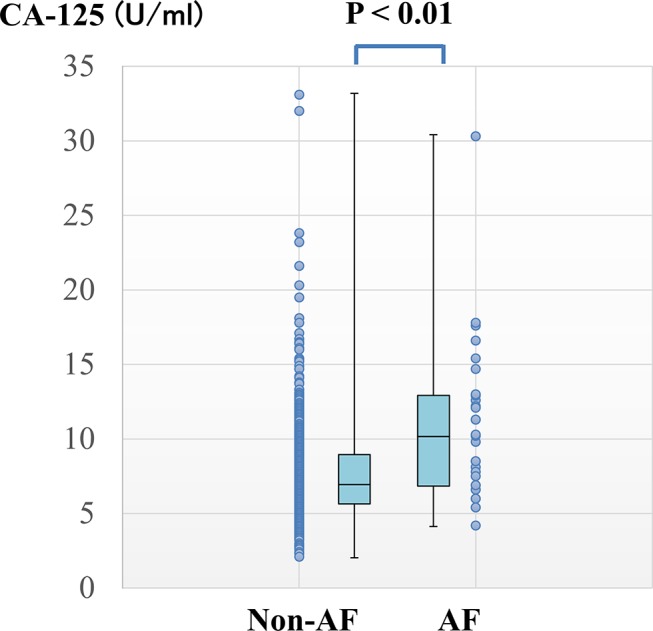
Figure 1.

Distribution of baseline CA-125 levels between the two groups. Box plot representing baseline CA-125 levels in the non-AF (left) and AF groups (right). The dots depict scatter plots of baseline CA-125 levels, whereas the graph shows the comparison of CA-125 levels (median ± IQR) between the two groups; p<0.001. AF, atrial fibrillation; CA-125, cancer antigen-125.
