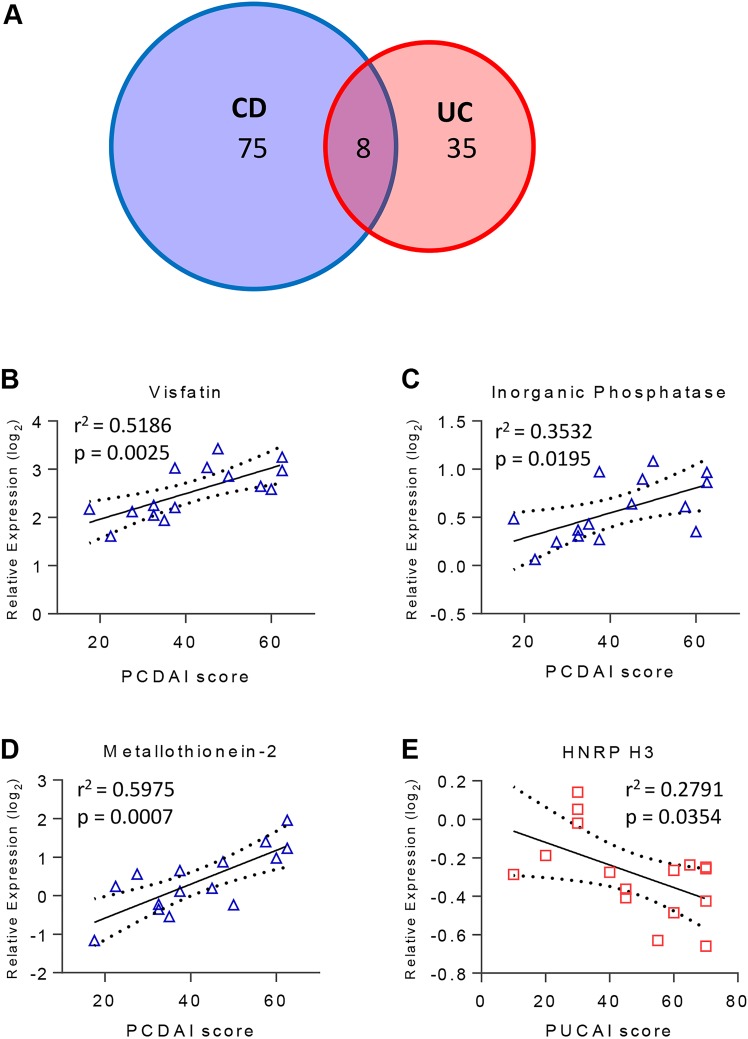
Figure 5.
(A) Venn diagram of the number of proteins that correlated with severity of disease in patients with Crohn's disease (CD) (blue) or UC (red) as determined by Pearson correlation analysis of the Pediatric Crohn's Disease Activity Index (PCDAI) or Pediatric UC Activity Index (PUCAI) score with the Q95 proteins+subgroup-specific proteins. (B–E) Scatter plots of the relative expression of proteins with significant correlation to severity score that are part of the (B and C) IBD versus control panel, and (D and E) CD versus UC panel are shown.

