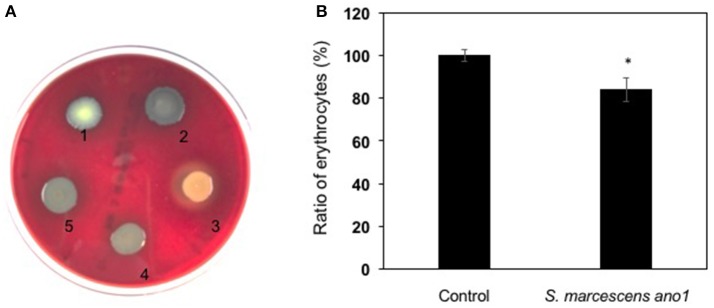
Figure 4.
Demonstration of alpha-hemolysin production and lysis of erythrocytes by S. marcescens. (A) Demonstration of hemolysin production in S. fonicola MSU001 (colony1), S. marcescens ano1 (colony 2), S.aureus (colony 3, beta-hemolysin control), E. meningoseptica (colony 4, alpha-hemolysin control), and S. marcescens ano1 (colony 5). (B) Lysis of the red blood cells by S. marcescens ano1. The control was the same as the treatment except no bacterial cells were inoculated. The asterisk indicates there was a significant difference between the control and treatment (student t-test, p < 0.01). Values are means of single measurements from triplicate cultures (±standard deviations).

