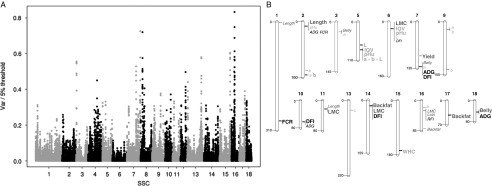
Figure 4.
(a) Manhattan plot for detection of associations between SNP and residual feed intake (RFI) (n=149 low RFI pigs, n=121 high RFI pigs), using a genomic relationship matrix to account for the pedigree structure. The y-axis corresponds to the ratio between the variance explained by successive 0.3 Mb windows as estimated from a single-step genomic selection approach and the empirical 5% significance threshold at the genome level computed by simulation under the null hypothesis. (b) Chromosomal location of SNPs with suggestive (small italic) or significant (large bold) P for each group of traits (growth rate, feed intake and feed efficiency in black, carcass traits in dark grey and meat quality traits in light grey). Adapted from Riquet et al. (2014). FCR=feed conversion ratio; RFI=residual feed intake; DFI=daily feed intake; ADG=average daily gain; LMC=lean meat content of the carcass computed from a linear combination of cut weights; backfat=backfat thickness measured on carcass or backfat weight; Length=carcass length; Yield=carcass yield; pHu=pH determined 24h after slaughter on adductor, semimembranosus, gluteus superficialis or longissimus muscles; L=lightness, a=redness, b=yellowness, measured 24 h after slaughter on gluteus superficialis or gluteus medius muscles; WHC=water holding capacity; MQI=meat quality index.

