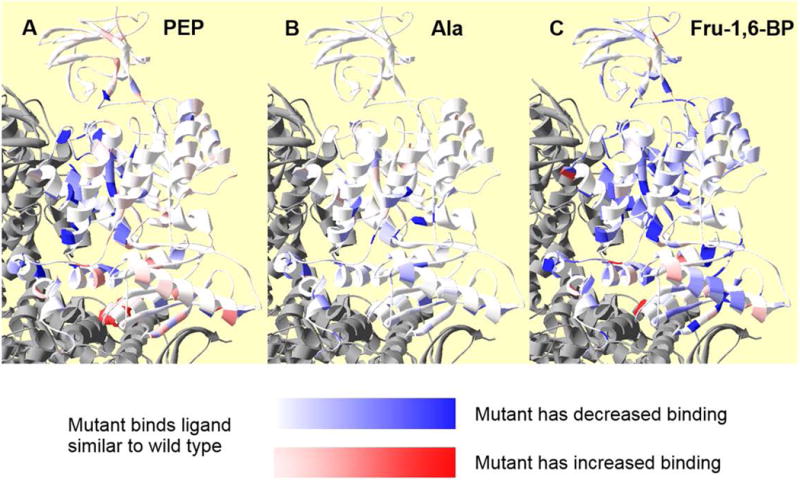
Figure 7.

Residue positions within a subunit at which side-chain removal alters ligand affinity/binding. In each panel, coloring represents relative change in apparent affinity (PEP) or binding (Fru-1,6-BP and Ala) when comparing values from mutant and wild type proteins. Neighboring subunits are in gray. The white to red gradient indicates increased affinity/binding (i.e., the deeper the red, the higher the affinity for the respective ligand to the protein containing a mutation at that residue position). The white to blue gradient indicates decreased affinity/binding (i.e., the deeper the blue, the lower the affinity for the respective ligand to the protein containing a mutation at that residue position). Panel A, indicates residue positions at which side-chain removal alters Ka-PEP. Positions 342, 346, 365, and 366 are in deep blue to reflect a large shift in PEP affinity, despite the lack of a quantitative assessment of this affinity. Unfortunately, the T340A mutation, which has the largest increase in PEP affinity, is not visible in this orientation of this ribbon structure; to improve visibility of this residue, T340 is in spacefill red and can be seen at the C-C subunit interface. Panel B indicates residue positions at which side-chain removal alters Kix-Ala. Panel C indicates residue positions at which side-chain removal alters Kix-Fru-1,6-BP.
