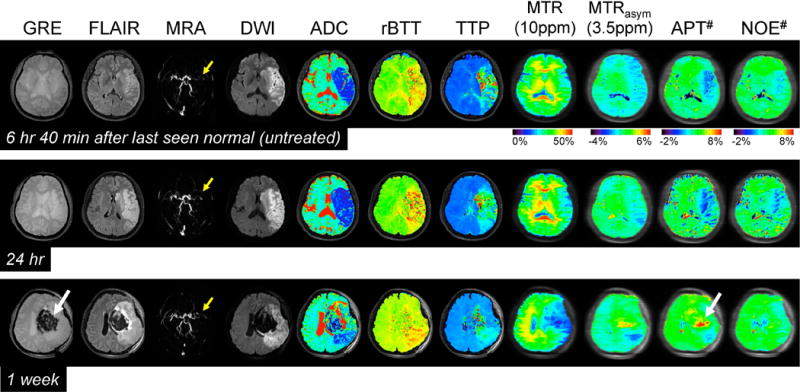
Figure 2.

Serial multimodality MR images of a representative acute stroke patient with left MCA occlusion (yellow arrows) at three time points. DWI and ADC showed large acute ischemic areas due to cytotoxic edema. In addition, perfusion-based rBTT and TTP showed obvious hypoperfusion in a slightly larger region than the diffusion abnormality. Both APT# and NOE# showed much clearer ischemic contrasts than MTRasym(3.5ppm) at two earlier time points. High APT signal intensities observed at 1 week can be attributed to a hemorrhage (white arrows) caused by abundant mobile proteins and peptides in the blood. Note that there was no significant contrast between normal and ischemic areas in MTR at 10 ppm within 1 day.
