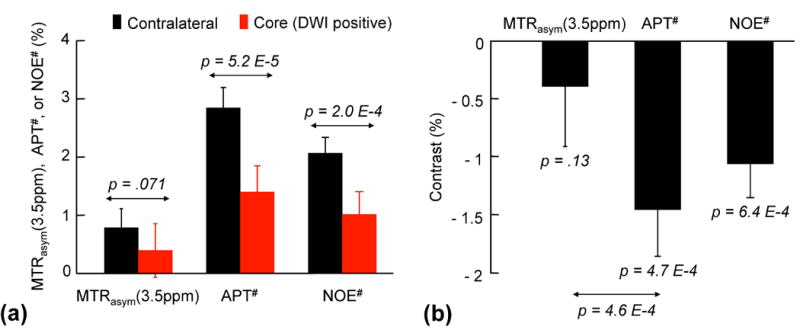
Figure 3.

Average MTRasym(3.5ppm), APT#, and NOE# image intensities and contrasts between acidic ischemic and contralateral normal tissues from thirty acute stroke patients. a: Both APT# and NOE# signal intensities of the ischemic lesion (DWI hyperintensity) were significantly lower than those of the contralateral normal tissue, while the MTRasym(3.5ppm) signals showed no significant difference. b: The NOE free-APT# image contrast between acidic ischemic and contralateral normal tissues outside the DWI lesion was much larger than the MTRasym(3.5ppm) image contrast.
