
Figure 4.
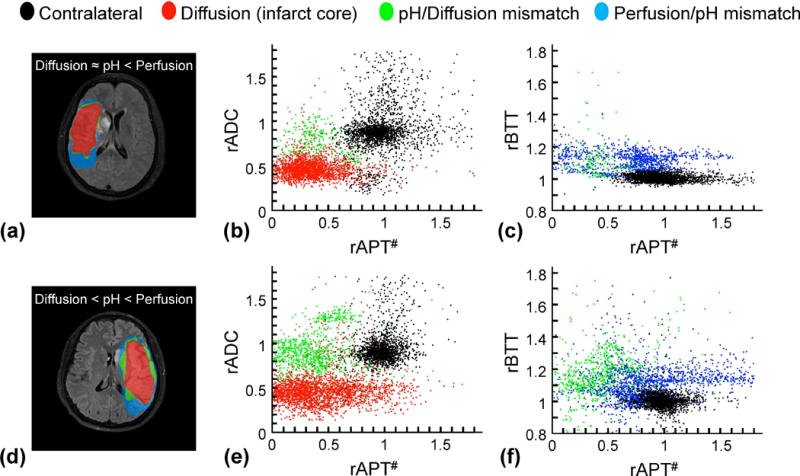
Comparisons of diffusion/pH/perfusion deficits and quantitative pH/diffusion and perfusion/pH scatterplots in two acute stroke patients at 1 day from symptom onset. a-c: A patient with pH/perfusion mismatch, but minor diffusion/pH mismatch. d–f: A patient with pH/perfusion mismatch, as well as diffusion/pH mismatch. All ischemic lesions in ADC, APT#, and rBTT images were automatically segmented using an algorithm with k-means clustering technique. The distributions of the diffusion deficit area (infarct core, red), pH-diffusion mismatch (acidosis-based penumbra, green), and perfusion-pH mismatch (acidosis-based benign oligemia, blue) were markedly different from those of the contralateral normal tissue (black).