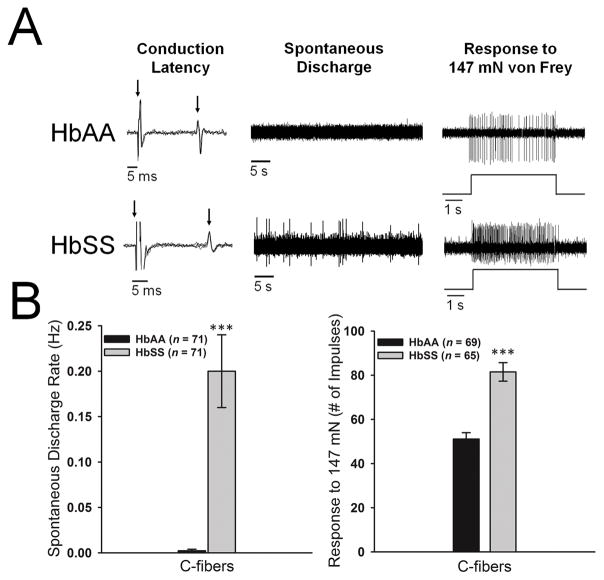
Figure 1.
A: Representative examples of C-fiber nociceptors isolated from HbAA-BERK control (top row) and HbSS-BERK (bottom row) mice. Left column: overlapping traces of conduction latency. Left arrow indicates onset of the stimulus and the right arrow indicates the evoked action potential. Middle column: examples of spontaneous activity for a period of 45 s. Right column: example of a response evoked by 147 mN applied for 5 s. Time of stimulation is illustrated below the evoked response. B: The mean spontaneous discharge rate and responses to 147 mN were higher in C-fibers isolated from HbSS-BERK sickle mice in comparison to HbAA-BERK control mice. ***p<.001 vs HbAA-BERK mice.

