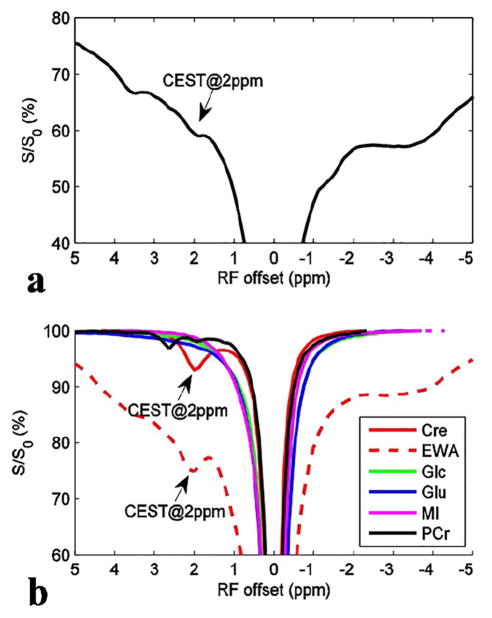
Figure 1.
CEST Z-spectra from a healthy rat brain (a) and control samples (b). Note that the CEST@2 ppm observed in rat brain may originate from both creatine and proteins. The region of interest (ROI) was chosen from the whole brain. The control samples contain creatine (Cre), glutamate (Glu), glucose (Glc), myo-inositol (MI), and phosphocreatine (PCr), respectively.

