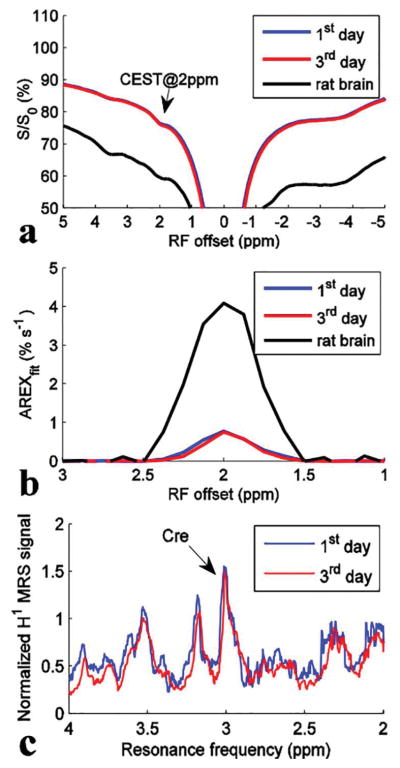
Figure 3.
CEST Z-spectra (a), AREXfit spectra (b), and 1H MRS spectra (c) from control #2 measured at day 1 (immediately after homogenization) (blue) and on the 3rd day (red) after the preparation of tissue homogenates, respectively. To compare with the in vivo result, the Z-spectrum and AREXfit spectrum on rat brain were also plotted in (a) and (b), respectively. T1w are ~3.6 s for control #2 measured at day 1, ~3.5 s for control #2 measured at the 3rd day, and ~1.9 s for the rat brain, respectively.

