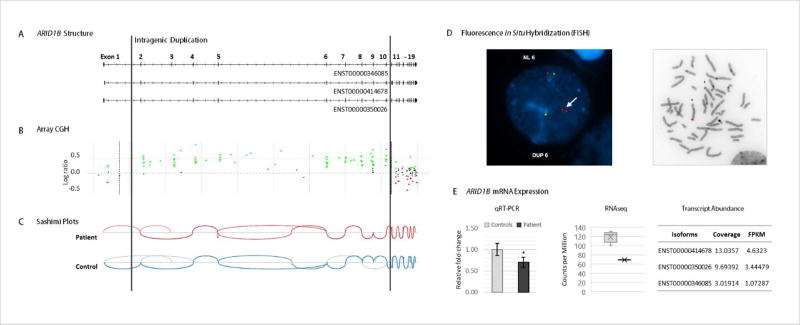
FIGURE 1.
Molecular and genetic characterization of the ARID1B microduplication. (a) Representation of the ARID1B transcripts expressed in the patient with exon numbering based on an Ensembl transcript ENST00000346085. (b)Array CGH shows the duplicated region comprising exons 2 to 10 between the vertical lines. (Green dots represent probes with log ratio above 0.2 and red dots those with log ratio below −0.2. Duplication or deletion is considered when probes are ≥0.4 or ≤−0.6, respectively.) (c) Sashimi plots generated from the RNAseq datasets depict the splice junctions that have a minimum of 3 reads supporting each junction.No novel junctions are observed in the patient. (d) FISH analysis (performed with a BAC clone, RP11-680A17, labeled in red and a control probe, RP11-719E16, labeled in green) confirms the duplication in interphase and metaphase cells, showing the duplication on chromosome 6 (as indicated by the white arrow) and not inserted into another chromosome. (e) (left to right) Decreased expression levels of ARID1B measured by qRT-PCR (using primers on exon 9 and on the junction of exons 10 and 11), in comparison to 7 age- and gender-matched controls (p-val 0.02), and by RNAseq in comparison to 5 age-matched controls. Error bars represent standard deviation. Transcript abundance analysis in the patient shows the 3 ARID1B expressed transcripts, measured from the RNAseq dataset using Cufflinks. [Color figure can be viewed at wileyonlinelibrary.com].

