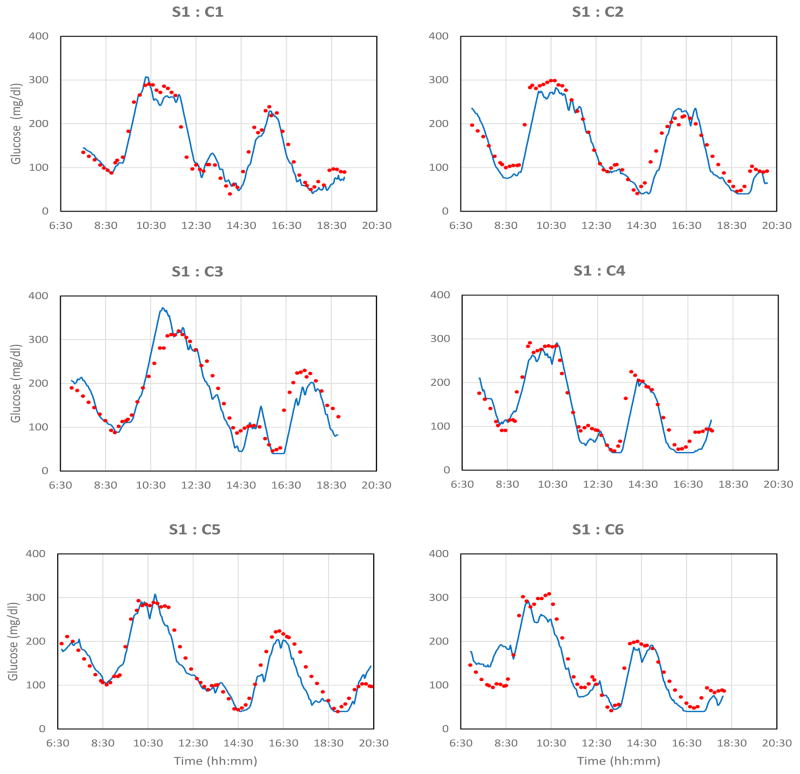
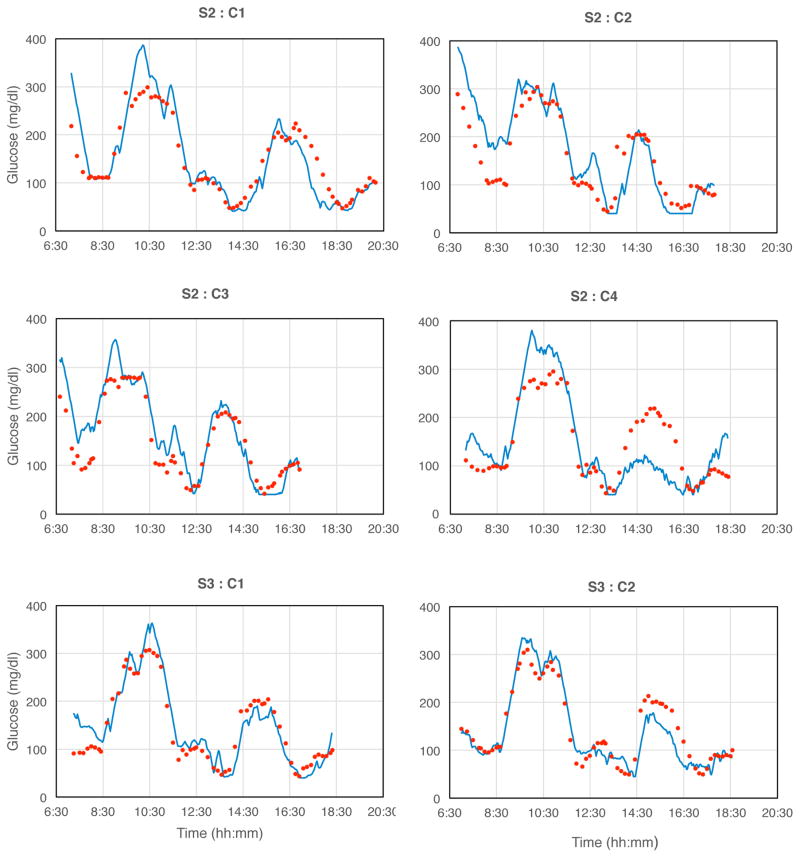
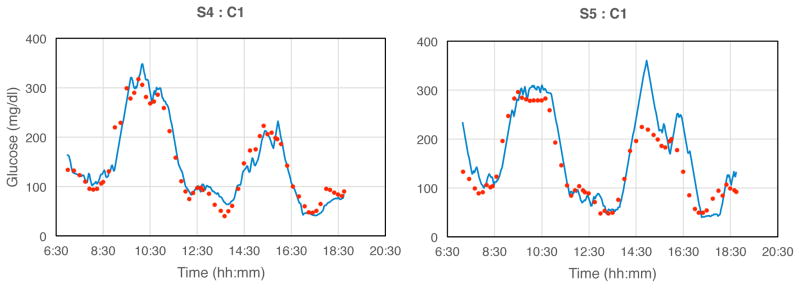
Fig. 2. Monthly glucose excursions created by controlled glucose and insulin infusions.
Blue lines: transmitted sensor signals; red points: blood glucose samples from forearm venous catheter assayed with the YSI blood glucose analyzer. The maximal rate of glucose change 3.66 mg/dl·min−1, which is representative of most rapid anticipated excursions in clinical situations [14]. Signals were truncated electronically below 40 and above 400 mg/dl.


