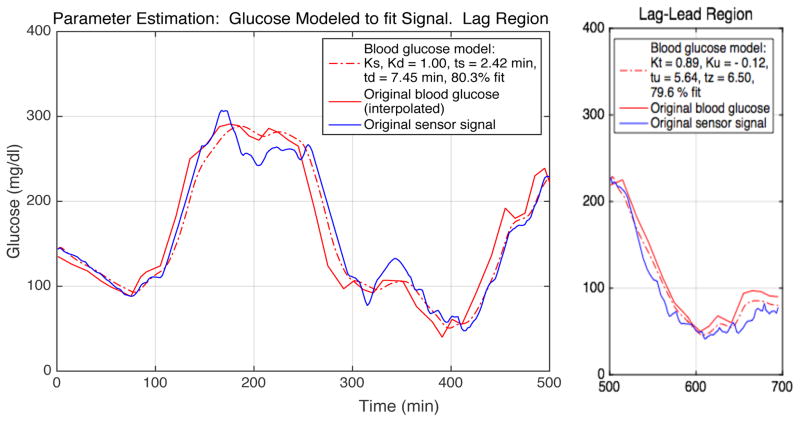
Fig. 5. An example of parameter estimation, S1:C1.
The interpolated blood glucose (red, solid line) is modeled (red, broken line) to approximate the original sensor signal (blue), allowing determination of the model parameter values needed to achieve a high goodness-of-fit. The lag and lag-lead regions are separated. Estimated parameter and goodness-of-fit values are given for each data region. The goodness-of-fit, or normalized root mean square error (NRMSE), is where y is the measured reference value and ŷ is the model output value.

