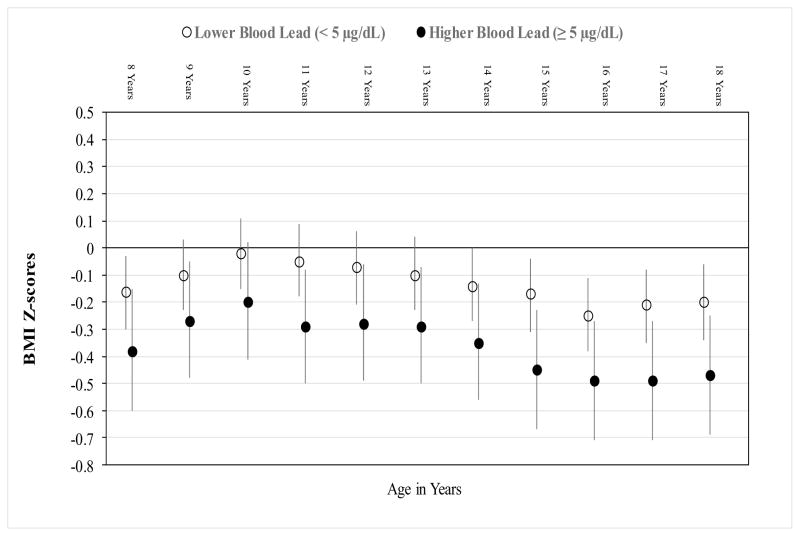
Figure 3.
Age-Specific Adjusted Mean (95% CI) BMI Z-scores by Baseline Blood Lead Levels
Adjusted repeated measures linear regression model, including birthweight, no biological father in home, percent calories from fat at baseline, age (years), and interaction between BLL and age.
P for interaction = 0.53

