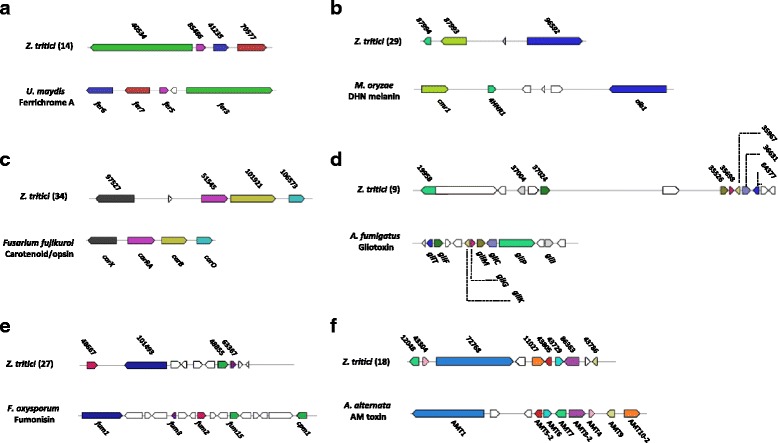
Fig. 2.

Schematic representation of conserved gene architecture between predicted Z. tritici loci and clusters from other fungi (a-f). Predicted gene boundaries are depicted by arrows and assigned Ensemble identifiers (Z. tritici) or gene names (other species). Identical colors between top and bottom loci are indicative of significant similarity at the level of encoded amino acid sequence (see Table 2). Non-colored arrows are predicted genes that lack an orthologue at the other respective locus. Numbers in parentheses are Z. tritici cluster number (see Table 1)
