
Fig. 1.
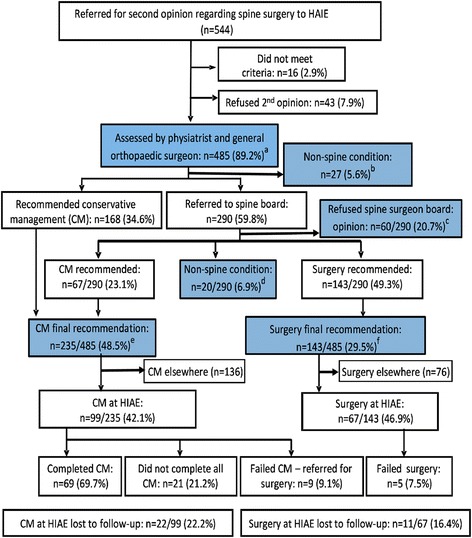
Second opinion flow chart. The boxes highlighted in blue summarise the main results: of the 425 participants who consented, were eligible to participate and agreed to complete the full second opinion protocol (a-c), 282 (66.4%) were not recommended surgery by the second opinion (b + d + e) and 143 (33.6%) were recommended spine surgery (f)